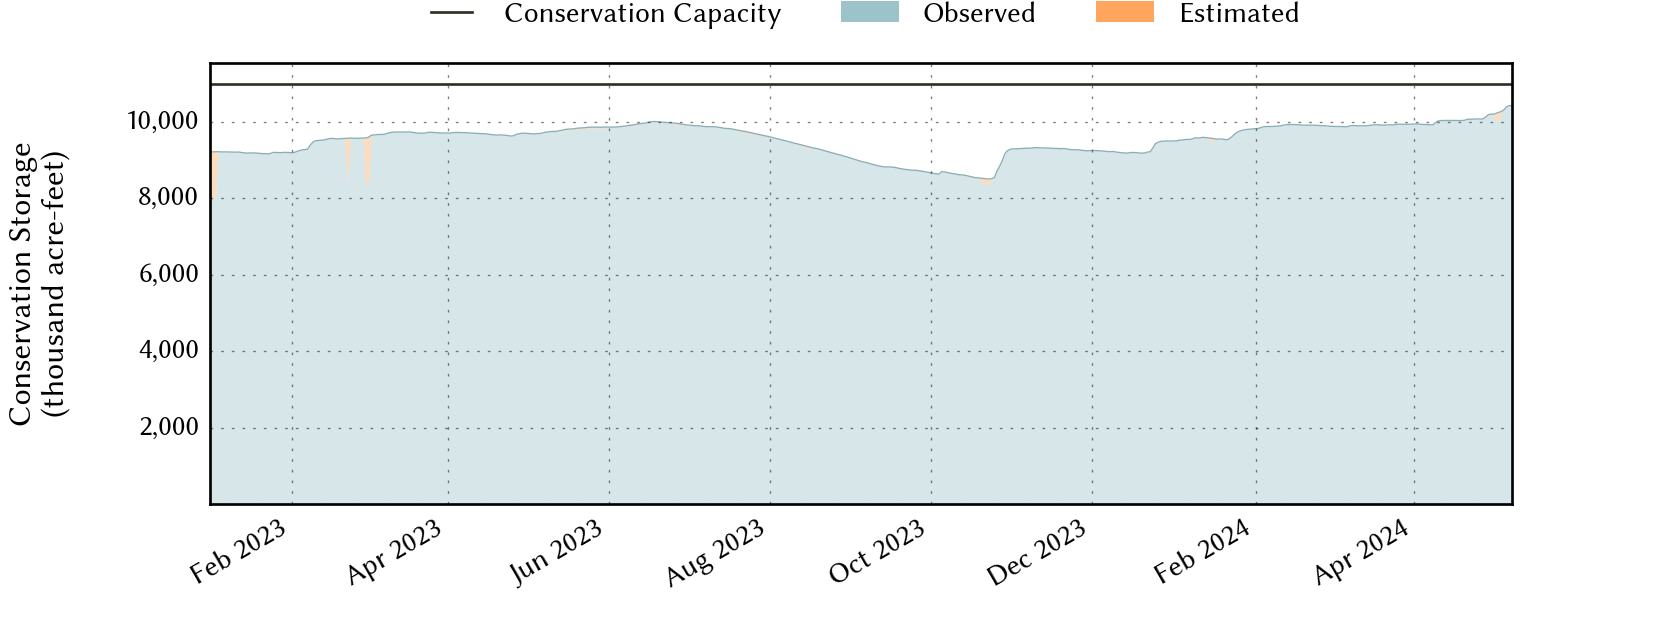
North-Central Climate Division Reservoirs: Monitored Water Supply Reservoirs are 93.8% full on 2026-08-01
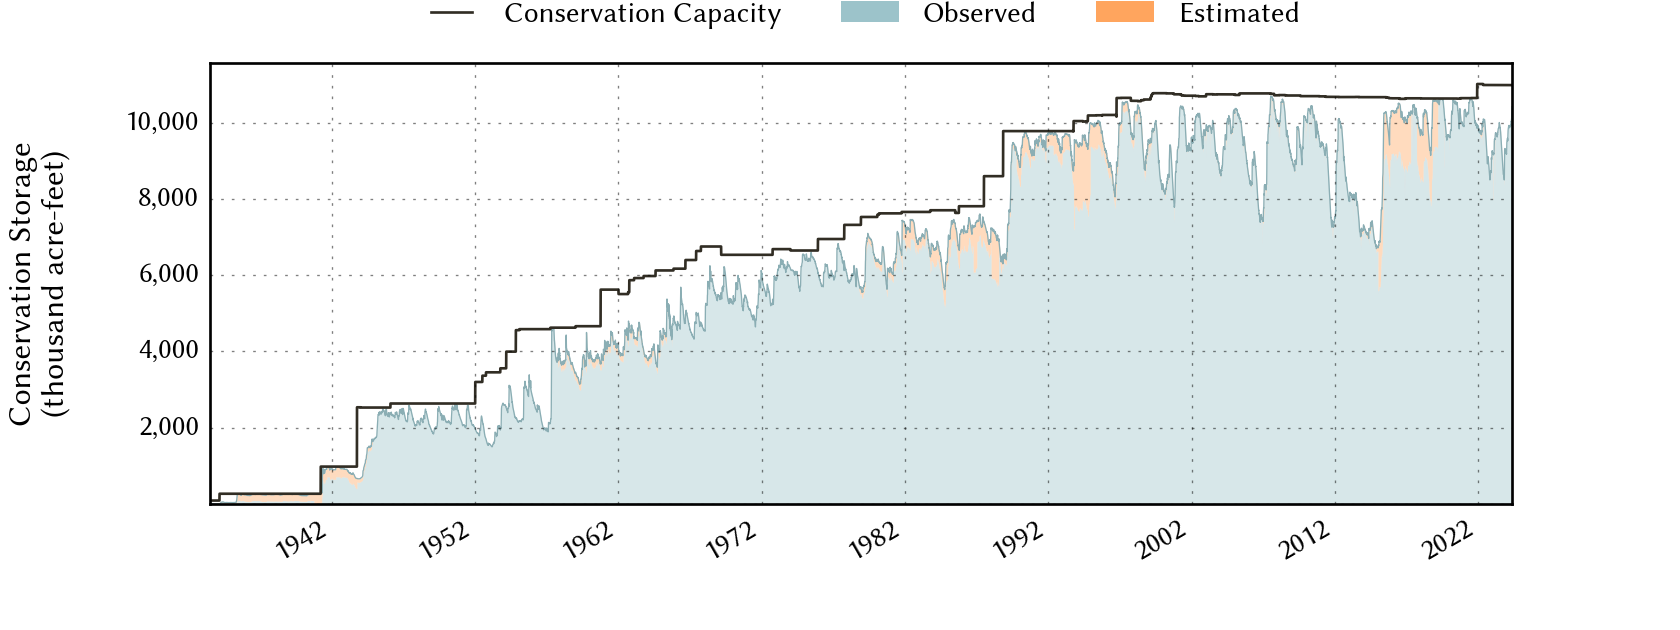
Historical Data
| Date | Percent Full |
Reservoir Storage (acre-ft) |
Conservation Storage (acre-ft) |
Conservation Capacity (acre-ft) |
|
|---|---|---|---|---|---|
| Today | 2026-08-01 | 93.8 | 11,777,978 | 10,301,023 | 10,983,823 |
| Yesterday | 2026-07-31 | 93.9 | 11,789,098 | 10,309,302 | 10,983,823 |
| 2 days ago | 2026-07-30 | 94.0 | 11,809,485 | 10,324,614 | 10,983,823 |
| 1 week ago | 2026-07-25 | 94.6 | 11,905,669 | 10,392,679 | 10,983,823 |
| 1 month ago | 2026-07-01 | 95.5 | 12,144,922 | 10,484,991 | 10,983,823 |
| 3 months ago | 2026-05-01 | 94.1 | 11,764,667 | 10,333,852 | 10,983,823 |
| 6 months ago | 2026-02-01 | 90.5 | 11,283,303 | 9,943,300 | 10,983,823 |
| 1 year ago | 2025-08-01 | 97.1 | 12,222,195 | 10,668,668 | 10,983,823 |
*
Percent Full is based on Conservation Storage and Conservation Capacity and doesn't account for storage in flood pool.
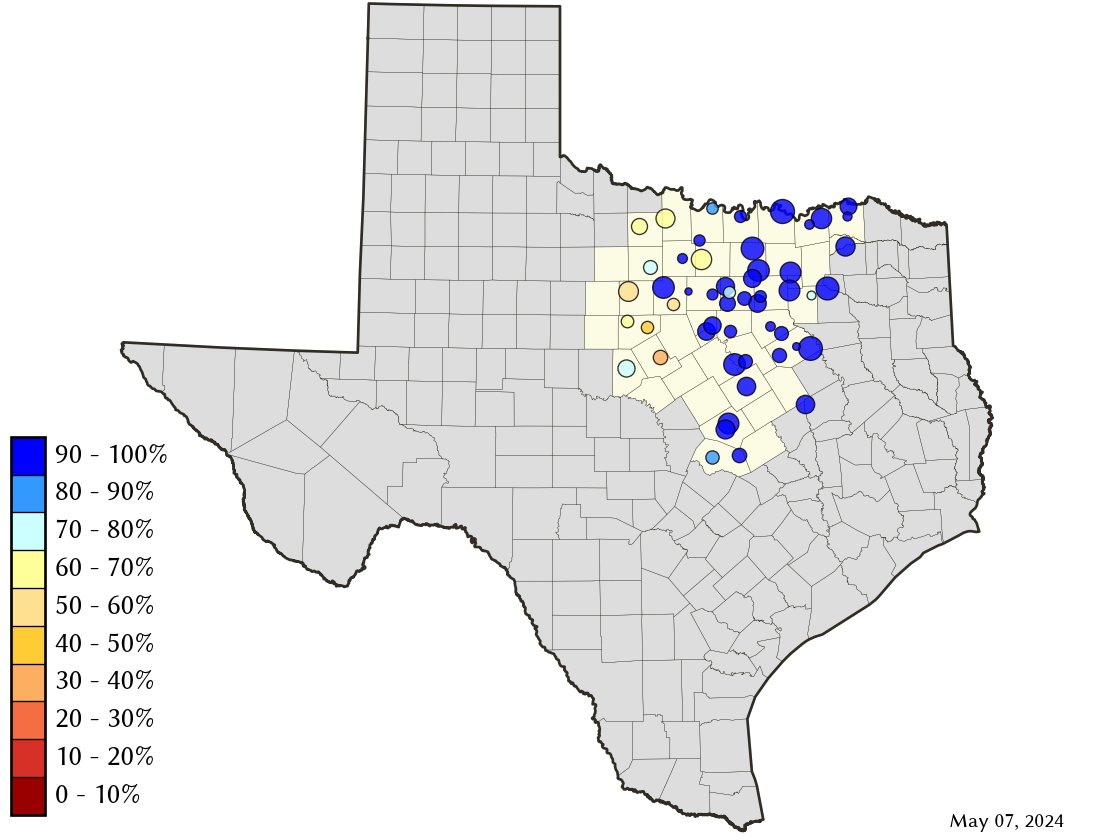
Area Map
Reservoir Storage
| Reservoir | Type | Percent Full |
Water Level (ft) |
Height Above Conservation Pool (ft) |
Reservoir Storage (acre-ft) |
Conservation Storage (acre-ft) |
Conservation Capacity (acre-ft) |
Surface Area (acres) |
|---|---|---|---|---|---|---|---|---|
| Amon G Carter |

|
83.9 | 917.78 | -2.22 | 16,945 | 16,161 | 19,266 | 1,324 |
| Aquilla |

|
98.9 | 537.34 | -0.16 | 42,787 | 42,751 | 43,243 | 3,067 |
| Arlington |
|
82.9 | 546.34 | -3.66 | 33,305 | 33,273 | 40,157 | 1,845 |
| Arrowhead |
|
78.2 | 922.29 | -3.71 | 180,092 | 180,092 | 230,359 | 12,592 |
| Bardwell |
|
97.8 | 420.70 | -0.30 | 42,935 | 42,874 | 43,856 | 3,254 |
| Belton |
|
100.0 | 594.71 | 0.71 | 441,533 | 432,631 | 432,631 | - n.a. - |
| Benbrook |
|
92.5 | 692.21 | -1.79 | 79,256 | 79,256 | 85,648 | 3,483 |
| Bois d'Arc |
|
98.1 | 533.56 | -0.44 | 360,538 | 360,538 | 367,609 | 16,336 |
| Bonham |
|
92.7 | 564.22 | -0.78 | 10,232 | 10,220 | 11,027 | 1,016 |
| Bridgeport |
|
83.9 | 830.86 | -5.14 | 312,087 | 312,087 | 372,183 | 11,140 |
| Brownwood |
|
91.4 | 1,423.21 | -1.39 | 119,662 | 119,662 | 130,868 | 6,446 |
| Cisco |
|
45.1 | 1,504.32 | -18.14 | 13,085 | 13,085 | 29,003 | 608 |
| Comanche Creek |
|
100.0 | 775.32 | 0.32 | 152,288 | 151,250 | 151,250 | - n.a. - |
| Crook |
|
96.5 | 475.69 | -0.31 | 8,887 | 8,872 | 9,195 | 1,039 |
| Eagle Mountain |
|
84.2 | 645.75 | -3.35 | 155,881 | 155,881 | 185,087 | 8,252 |
| Georgetown |
|
100.0 | 791.39 | 0.39 | 38,580 | 38,005 | 38,005 | - n.a. - |
| Graham |
|
73.1 | 1,069.67 | -5.33 | 33,131 | 33,117 | 45,288 | 2,058 |
| Granbury |
|
92.8 | 691.50 | -1.20 | 124,314 | 123,405 | 132,949 | 7,734 |
| Granger |
|
100.0 | 505.35 | 1.35 | 57,564 | 51,822 | 51,822 | - n.a. - |
| Grapevine |
|
99.4 | 534.85 | -0.15 | 162,077 | 162,077 | 163,064 | 6,561 |
| Halbert |
|
81.3 | 365.96 | -2.04 | 4,902 | 4,902 | 6,033 | 531 |
| Hubbard Creek |
|
40.5 | 1,167.79 | -15.52 | 131,770 | 126,894 | 313,298 | 8,607 |
| Hubert H Moss |
|
96.0 | 714.09 | -0.91 | 23,182 | 23,085 | 24,058 | 1,058 |
| Jim Chapman |
|
84.3 | 437.66 | -2.34 | 253,957 | 218,182 | 258,723 | 16,652 |
| Joe Pool |
|
97.8 | 521.51 | -0.49 | 147,753 | 146,383 | 149,629 | 6,564 |
| Kickapoo |
|
85.8 | 1,042.81 | -2.19 | 74,048 | 74,048 | 86,345 | 5,366 |
| Lavon |
|
95.8 | 491.16 | -0.84 | 395,432 | 392,591 | 409,757 | 20,264 |
| Leon |
|
84.2 | 1,372.35 | -2.65 | 23,665 | 23,385 | 27,762 | 1,548 |
| Lewisville |
|
97.1 | 521.40 | -0.60 | 582,822 | 547,148 | 563,228 | 26,589 |
| Limestone |
|
95.4 | 362.23 | -0.77 | 194,330 | 194,330 | 203,780 | 12,141 |
| Lost Creek |
|
92.4 | 1,007.18 | -2.32 | 11,047 | 11,047 | 11,950 | - n.a. - |
| Mineral Wells |
|
96.1 | 862.55 | -0.45 | 5,065 | 5,065 | 5,273 | 455 |
| Mountain Creek |
|
100.0 | 457.44 | 0.44 | 23,938 | 22,850 | 22,850 | 2,804 |
| Navarro Mills |
|
92.4 | 423.68 | -0.82 | 46,036 | 46,035 | 49,827 | 4,545 |
| New Terrell City |
|
29.5 | 494.60 | -9.40 | 2,541 | 2,530 | 8,583 | 400 |
| Nocona |
|
79.5 | 824.06 | -3.44 | 17,351 | 17,047 | 21,444 | 1,212 |
| Palo Pinto |
|
91.6 | 865.95 | -1.05 | 24,891 | 24,505 | 26,766 | 2,133 |
| Pat Cleburne |
|
94.0 | 732.49 | -1.01 | 24,443 | 24,443 | 26,008 | 1,535 |
| Pat Mayse |
|
100.0 | 451.12 | 0.12 | 118,521 | 113,683 | 113,683 | - n.a. - |
| Possum Kingdom |
|
93.4 | 996.97 | -2.03 | 502,718 | 502,718 | 538,139 | 16,977 |
| Proctor |
|
78.6 | 1,159.34 | -2.66 | 43,070 | 43,070 | 54,762 | 4,118 |
| Ray Hubbard |
|
96.0 | 434.64 | -0.86 | 421,906 | 421,906 | 439,559 | 20,251 |
| Ray Roberts |
|
99.2 | 632.29 | -0.21 | 782,547 | 782,224 | 788,167 | 28,225 |
| Richland-Chambers |
|
95.7 | 313.90 | -1.10 | 1,077,421 | 1,051,638 | 1,099,417 | 42,995 |
| Stillhouse Hollow |
|
100.0 | 622.56 | 0.56 | 233,505 | 229,796 | 229,796 | - n.a. - |
| Tawakoni |
|
98.3 | 437.09 | -0.41 | 856,620 | 856,612 | 871,685 | 36,522 |
| Texoma 1 |
|
100.0 | 618.12 | 1.12 | 2,574,034 | 1,243,801 | 1,243,801 | 78,784 |
| Waco |
|
97.2 | 461.58 | -0.64 | 183,752 | 183,526 | 188,891 | 8,327 |
| Waxahachie |
|
93.2 | 530.34 | -1.16 | 10,892 | 10,310 | 11,060 | 638 |
| Weatherford |
|
62.3 | 889.15 | -6.85 | 11,097 | 11,097 | 17,812 | 892 |
| Whitney |
|
99.2 | 532.81 | -0.19 | 561,767 | 560,413 | 564,808 | 23,045 |
| Worth |
|
76.6 | 592.28 | -1.72 | 27,776 | 18,700 | 24,419 | 3,222 |
footnotes
1
Lake Texoma straddles the border of Texas and Oklahoma, Texas has rights to 50% of Lake Texoma's total conservation capacity. Percent full, conservation storage and conservation capacity are based on the Texas share.