Reservoir Storage Summary for Climate Divisions on 2026-07-23
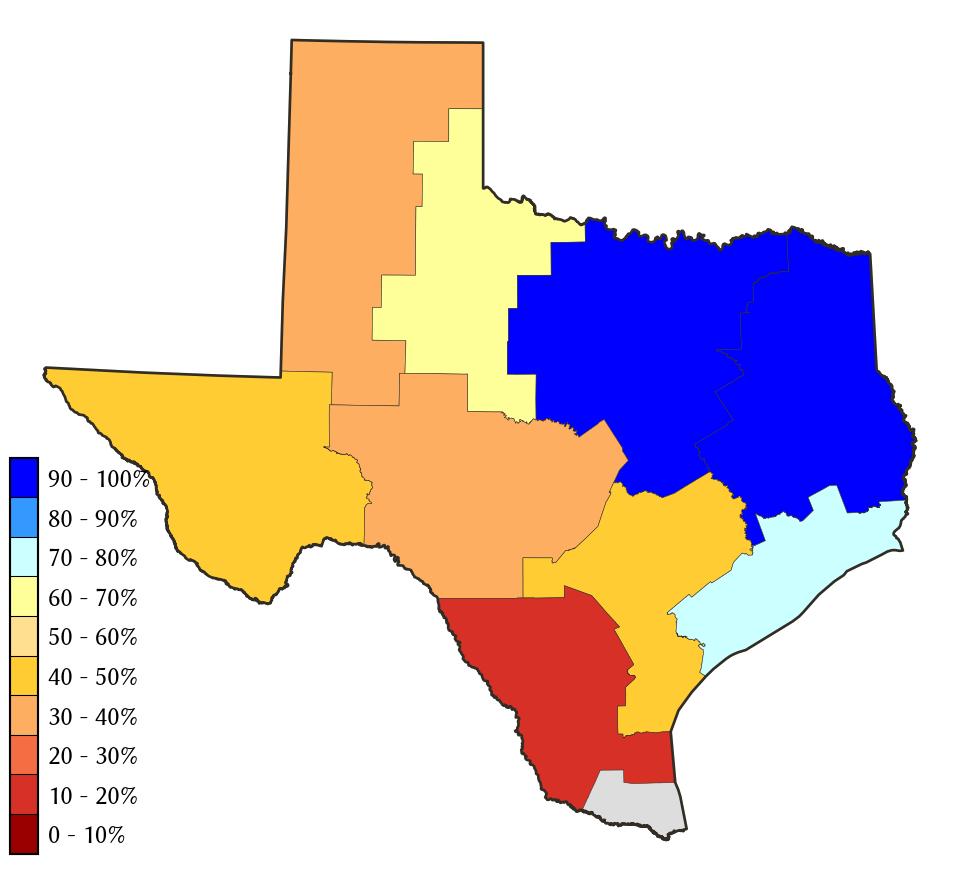
Percent Full
| Today | Yesterday | 2 days ago | 1 week ago | 1 month ago | 3 months ago | 6 months ago | 1 year ago | |
|---|---|---|---|---|---|---|---|---|
| 2026-07-23 | 2026-07-22 | 2026-07-21 | 2026-07-16 | 2026-06-23 | 2026-04-23 | 2026-01-23 | 2025-07-23 | |
| East Texas | 88.4 | 88.5 | 88.5 | 88.7 | 89.3 | 86.7 | 84.1 | 94.5 |
| Edwards Plateau | 47.9 | 47.9 | 47.7 | 45.0 | 45.2 | 45.3 | 46.4 | 48.3 |
| High Plains | 36.0 | 36.1 | 36.1 | 36.3 | 37.0 | 37.6 | 39.0 | 39.7 |
| Low Rolling Plains | 58.9 | 59.0 | 59.1 | 57.6 | 62.2 | 62.9 | 64.4 | 72.5 |
| North Central | 94.9 | 95.0 | 95.1 | 95.1 | 95.8 | 93.7 | 90.5 | 97.9 |
| South | 23.8 | 23.2 | 23.0 | 20.8 | 21.7 | 16.2 | 15.8 | 15.9 |
| South Central | 90.3 | 90.2 | 90.2 | 75.2 | 72.5 | 61.8 | 64.9 | 76.0 |
| Trans Pecos | 48.5 | 48.5 | 48.5 | 48.5 | 51.0 | 54.5 | 54.3 | 50.2 |
| Upper Coast | 99.1 | 99.2 | 99.1 | 100.0 | 99.0 | 71.8 | 78.2 | 98.5 |
*
Percent Full is based on Conservation Storage and Conservation Capacity.
Recent Conditions
| Percent Full |
Reservoir Storage (acre-ft) |
Conservation Storage (acre-ft) |
Conservation Capacity (acre-ft) |
|
|---|---|---|---|---|
| East Texas | 88.4 | 11,236,831 | 8,768,607 | 9,915,173 |
| Edwards Plateau | 47.9 | 2,181,474 | 2,042,834 | 4,261,647 |
| High Plains | 36.0 | 268,898 | 230,484 | 639,362 |
| Low Rolling Plains | 58.9 | 535,350 | 532,806 | 903,870 |
| North Central | 94.9 | 11,950,844 | 10,421,121 | 10,983,823 |
| South | 23.8 | 728,116 | 589,829 | 2,481,249 |
| South Central | 90.3 | 1,826,534 | 1,748,179 | 1,936,953 |
| Trans Pecos | 48.5 | 70,393 | 70,393 | 145,165 |
| Upper Coast | 99.1 | 298,283 | 288,560 | 291,293 |
**
The Lower Valley climate division has no contributing Reservoirs present.