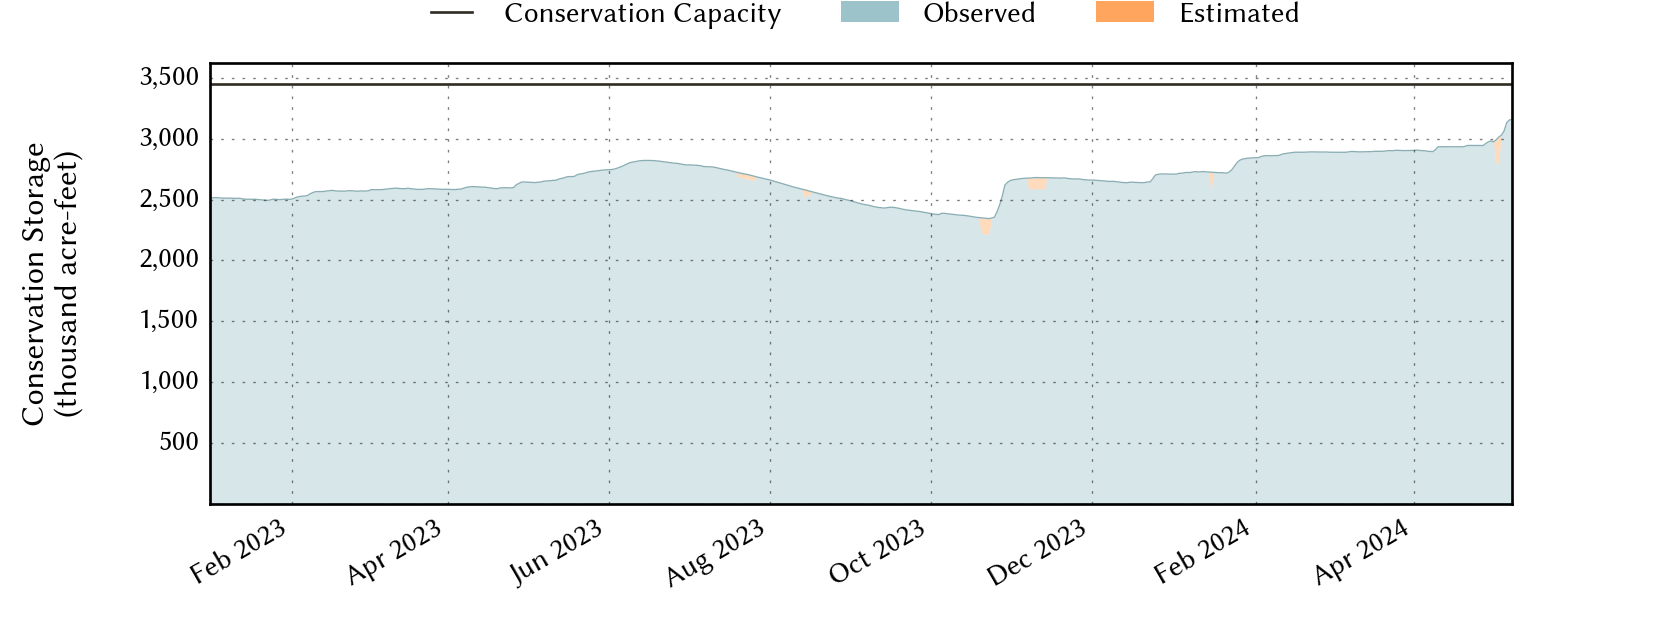
Brazos-G Planning Region Reservoirs: Monitored Water Supply Reservoirs are 90.6% full on 2026-07-21
Historical Data
| Date | Percent Full |
Reservoir Storage (acre-ft) |
Conservation Storage (acre-ft) |
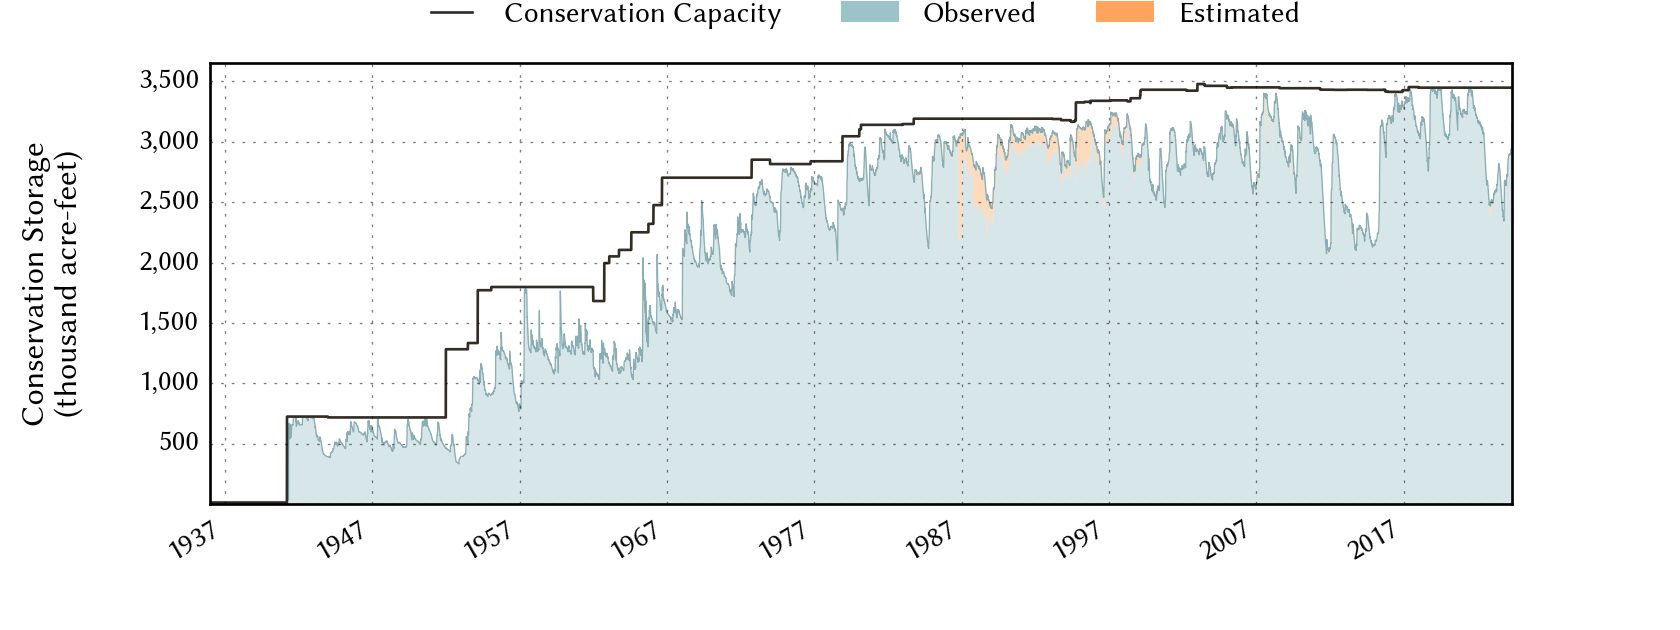
Conservation Capacity (acre-ft) |
|
|---|---|---|---|---|---|
| Today | 2026-07-21 | 90.6 | 3,203,548 | 3,123,547 | 3,448,023 |
| Yesterday | 2026-07-20 | 90.6 | 3,206,227 | 3,124,198 | 3,448,023 |
| 2 days ago | 2026-07-19 | 90.6 | 3,208,867 | 3,124,423 | 3,448,023 |
| 1 week ago | 2026-07-14 | 90.0 | 3,156,539 | 3,101,831 | 3,448,023 |
| 1 month ago | 2026-06-21 | 91.1 | 3,270,064 | 3,140,232 | 3,448,023 |
| 3 months ago | 2026-04-21 | 87.9 | 3,050,600 | 3,029,760 | 3,448,023 |
| 6 months ago | 2026-01-21 | 86.2 | 2,984,498 | 2,973,249 | 3,448,023 |
| 1 year ago | 2025-07-21 | 94.2 | 3,500,071 | 3,249,140 | 3,448,023 |
*
Percent Full is based on Conservation Storage and Conservation Capacity and doesn't account for storage in flood pool.
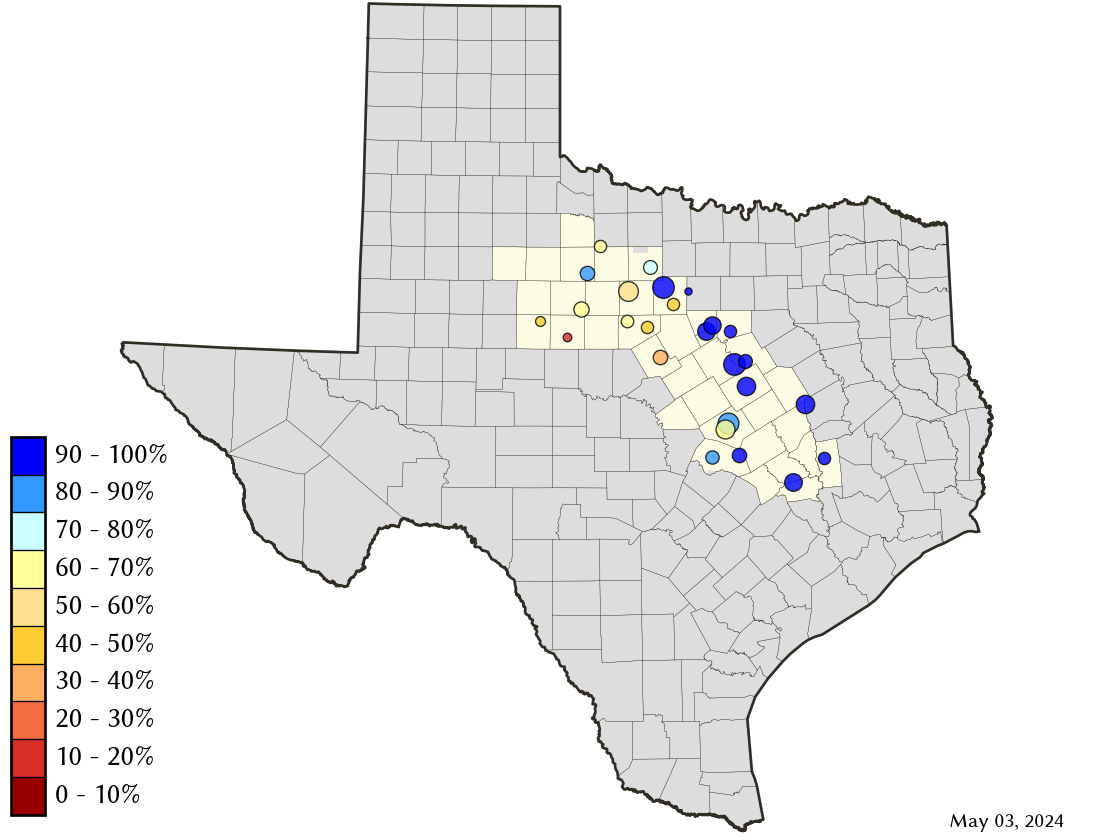
Area Map
Reservoir Storage
| Reservoir | Type | Percent Full |
Water Level (ft) |
Height Above Conservation Pool (ft) |
Reservoir Storage (acre-ft) |
Conservation Storage (acre-ft) |
Conservation Capacity (acre-ft) |
Surface Area (acres) |
|---|---|---|---|---|---|---|---|---|
| Abilene |

|
14.0 | 1,994.70 | -17.60 | 1,103 | 1,103 | 7,900 | 182 |
| Aquilla |

|
100.0 | 538.38 | 0.88 | 46,039 | 43,243 | 43,243 | - n.a. - |
| Belton |
|
100.0 | 595.11 | 1.11 | 446,606 | 432,631 | 432,631 | - n.a. - |
| Cisco |
|
45.8 | 1,504.64 | -17.82 | 13,275 | 13,275 | 29,003 | 616 |
| Comanche Creek |
|
100.0 | 775.45 | 0.45 | 152,702 | 151,250 | 151,250 | - n.a. - |
| Fort Phantom Hill |
|
76.5 | 1,631.27 | -4.63 | 53,550 | 53,544 | 70,030 | 3,212 |
| Georgetown |
|
100.0 | 792.67 | 1.67 | 40,293 | 38,005 | 38,005 | - n.a. - |
| Gibbons Creek |
|
98.2 | 246.82 | -0.18 | 26,967 | 25,263 | 25,721 | 2,533 |
| Graham |
|
75.4 | 1,070.17 | -4.83 | 34,172 | 34,158 | 45,288 | 2,109 |
| Granbury |
|
95.6 | 691.98 | -0.72 | 128,069 | 127,160 | 132,949 | 7,910 |
| Granger |
|
100.0 | 506.46 | 2.46 | 62,585 | 51,822 | 51,822 | - n.a. - |
| Hubbard Creek |
|
41.5 | 1,168.14 | -15.17 | 134,807 | 129,931 | 313,298 | 8,750 |
| Leon |
|
85.6 | 1,372.60 | -2.40 | 24,054 | 23,774 | 27,762 | 1,567 |
| Limestone |
|
97.6 | 362.60 | -0.40 | 198,845 | 198,845 | 203,780 | 12,266 |
| Millers Creek |
|
67.3 | 1,329.37 | -4.63 | 19,301 | 18,018 | 26,768 | 1,546 |
| Mineral Wells |
|
98.4 | 862.82 | -0.18 | 5,189 | 5,189 | 5,273 | 462 |
| Palo Pinto |
|
94.8 | 866.36 | -0.64 | 25,768 | 25,382 | 26,766 | 2,149 |
| Pat Cleburne |
|
96.7 | 732.94 | -0.56 | 25,137 | 25,137 | 26,008 | 1,548 |
| Possum Kingdom |
|
94.2 | 997.21 | -1.79 | 506,806 | 506,806 | 538,139 | 17,091 |
| Proctor |
|
82.0 | 1,159.78 | -2.22 | 44,913 | 44,913 | 54,762 | 4,239 |
| Somerville |
|
100.0 | 240.27 | 2.27 | 177,118 | 150,293 | 150,293 | - n.a. - |
| Stamford |
|
76.4 | 1,414.42 | -2.38 | 39,379 | 39,376 | 51,570 | 4,206 |
| Stillhouse Hollow |
|
100.0 | 623.26 | 1.26 | 238,097 | 229,796 | 229,796 | - n.a. - |
| Sweetwater |
|
20.0 | 2,092.43 | -24.07 | 2,451 | 2,451 | 12,267 | 226 |
| Waco |
|
99.2 | 462.04 | -0.18 | 187,600 | 187,374 | 188,891 | 8,407 |
| Whitney |
|
100.0 | 533.11 | 0.11 | 568,722 | 564,808 | 564,808 | - n.a. - |