South-Central-Texas Planning Region Reservoirs: Monitored Water Supply Reservoirs are 72.0% full on 2026-07-28
Historical Data
| Date | Percent Full |
Reservoir Storage (acre-ft) |
Conservation Storage (acre-ft) |
Conservation Capacity (acre-ft) |
|
|---|---|---|---|---|---|
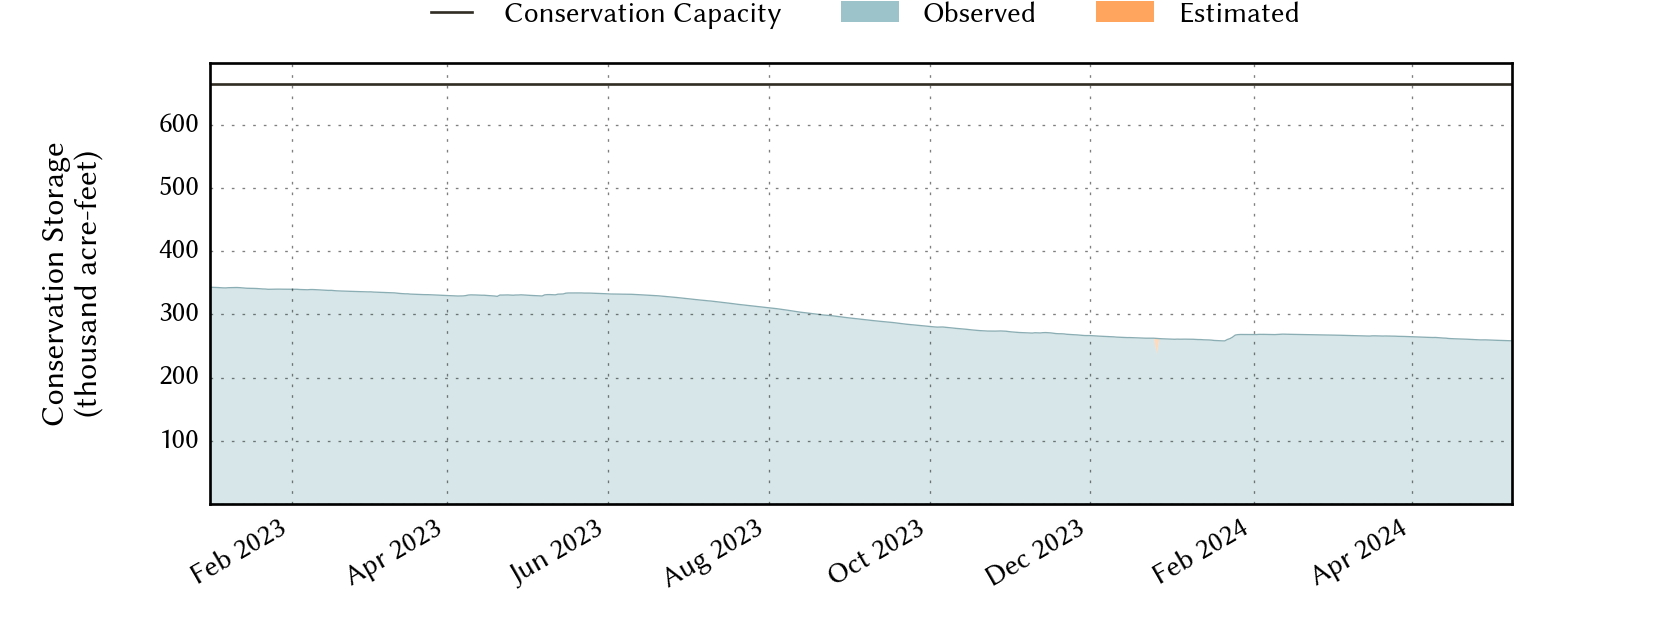
| Today | 2026-07-28 | 72.0 | 486,752 | 478,720 | 664,644 |
| Yesterday | 2026-07-27 | 72.0 | 486,046 | 478,515 | 664,644 |
| 2 days ago | 2026-07-26 | 71.9 | 484,937 | 478,073 | 664,644 |
| 1 week ago | 2026-07-21 | 71.5 | 475,439 | 475,038 | 664,644 |
| 1 month ago | 2026-06-28 | 42.4 | 282,196 | 282,125 | 664,644 |
| 3 months ago | 2026-04-28 | 38.5 | 256,078 | 256,007 | 664,644 |
| 6 months ago | 2026-01-28 | 40.0 | 265,838 | 265,767 | 664,644 |
| 1 year ago | 2025-07-28 | 46.0 | 306,070 | 305,999 | 664,644 |
*
Percent Full is based on Conservation Storage and Conservation Capacity and doesn't account for storage in flood pool.
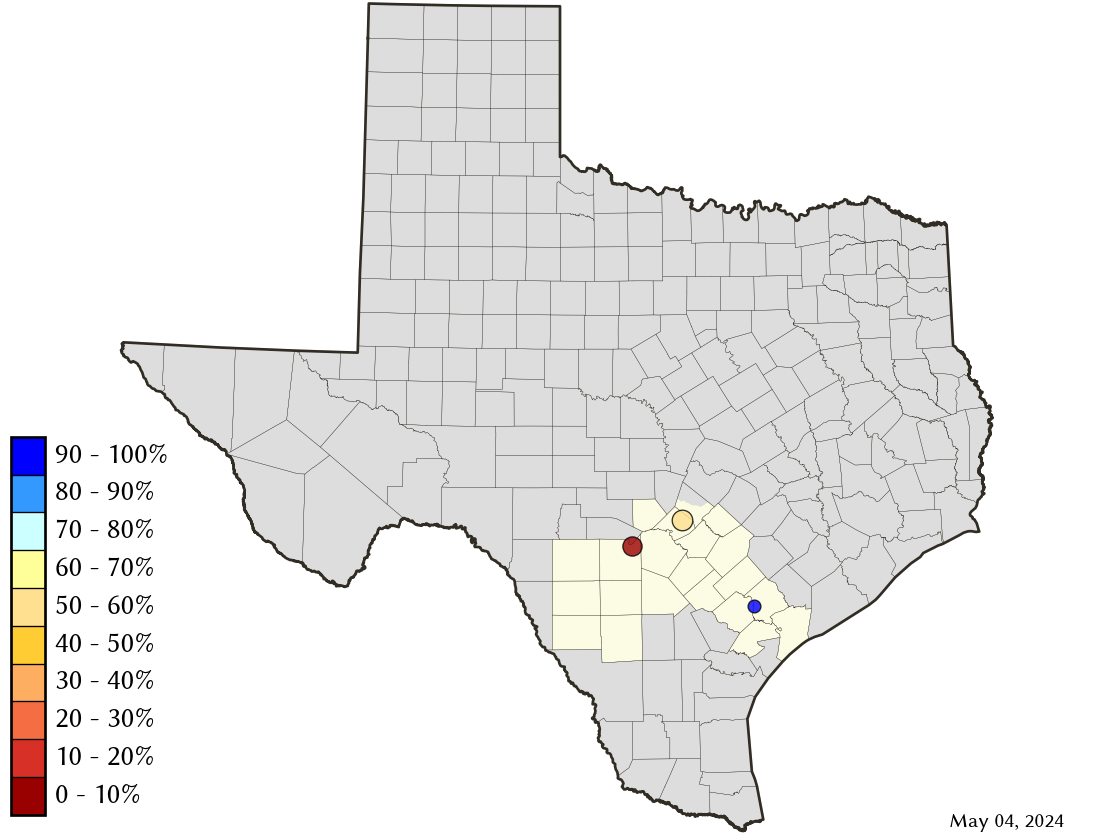
Area Map
Reservoir Storage
| Reservoir | Type | Percent Full |
Water Level (ft) |
Height Above Conservation Pool (ft) |
Reservoir Storage (acre-ft) |
Conservation Storage (acre-ft) |
Conservation Capacity (acre-ft) |
Surface Area (acres) |
|---|---|---|---|---|---|---|---|---|
| Canyon |

|
100.0 | 909.96 | 0.96 | 386,813 | 378,781 | 378,781 | - n.a. - |
| Coleto Creek |

|
82.6 | 95.73 | -2.27 | 25,633 | 25,633 | 31,040 | 2,331 |
| Medina |
|
29.2 | 1,021.16 | -43.04 | 74,306 | 74,306 | 254,823 | 2,487 |