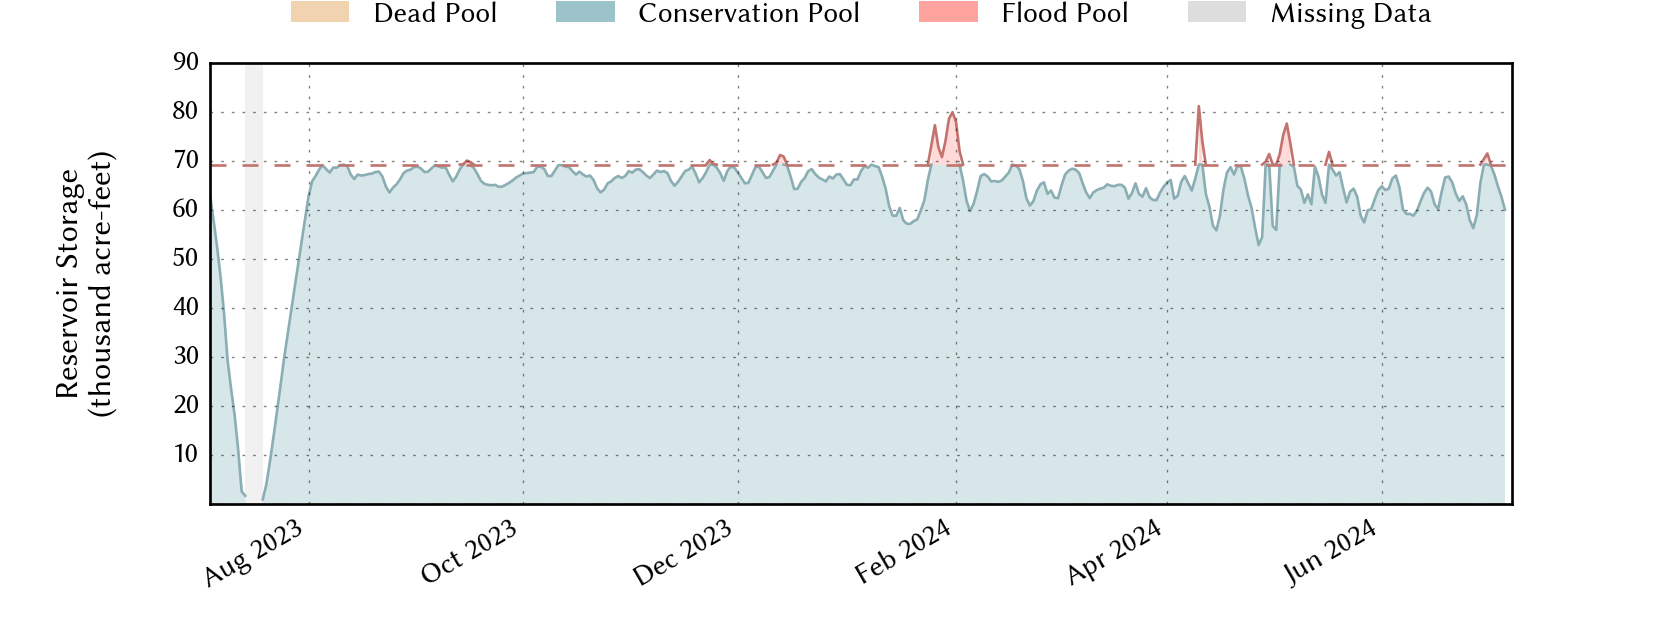
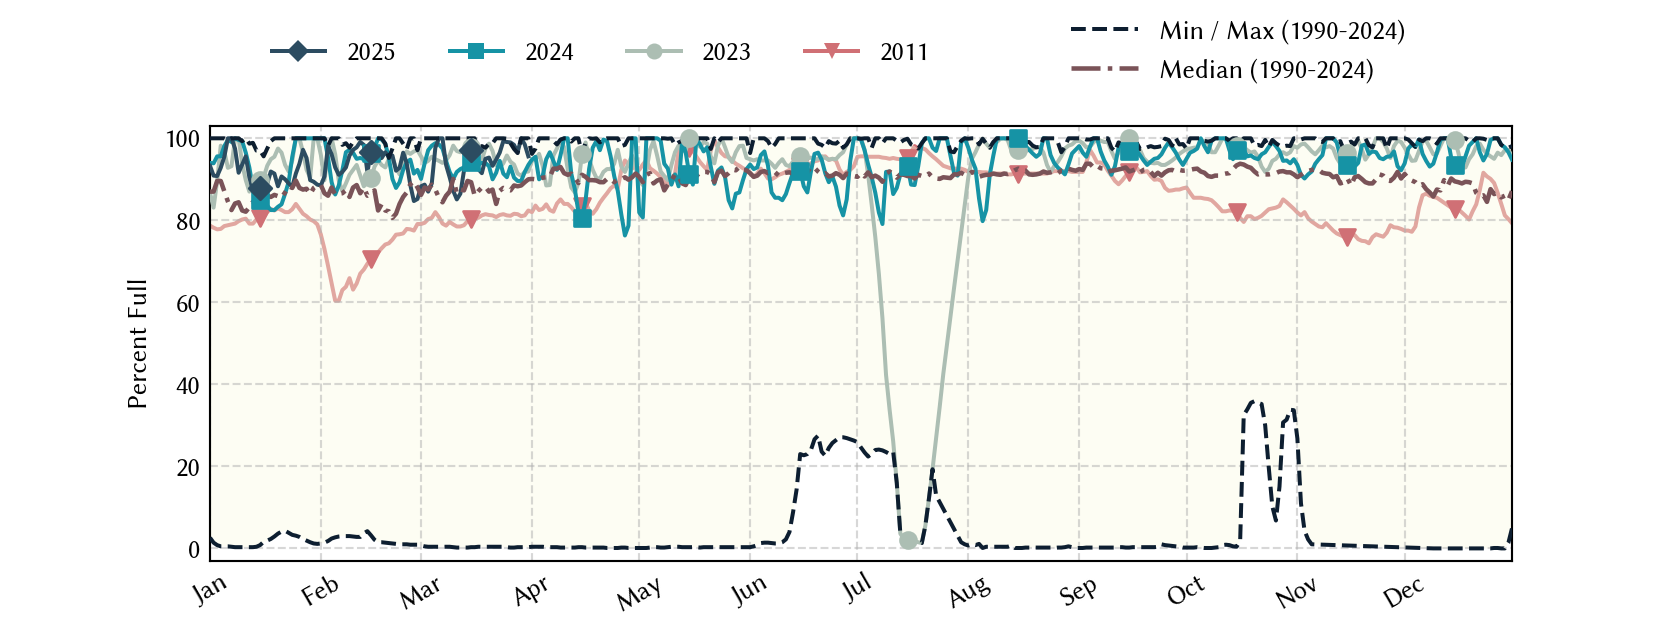
B. A. Steinhagen Lake: 97.2% full as of 2026-07-31
Historical Data
| Date | Percent Full |
Mean Water Level (ft) |
Reservoir Storage (acre-ft) |
Conservation Storage (acre-ft) |
Conservation Capacity (acre-ft) |
Surface Area (acres) |
|
|---|---|---|---|---|---|---|---|
| Today | 2026-07-31 | 97.2 | 82.81 | 67,332 | 67,259 | 69,186 | 10,060 |
| Yesterday | 2026-07-30 | 95.9 | 82.72 | 66,430 | 66,357 | 69,186 | 9,977 |
| 2 days ago | 2026-07-29 | 94.6 | 82.63 | 65,536 | 65,463 | 69,186 | 9,894 |
| 1 week ago | 2026-07-24 | 93.2 | 82.53 | 64,552 | 64,479 | 69,186 | 9,802 |
| 1 month ago | 2026-06-30 | 94.2 | 82.60 | 65,239 | 65,166 | 69,186 | 9,867 |
| 3 months ago | 2026-04-30 | 98.4 | 82.89 | 68,140 | 68,067 | 69,186 | 10,134 |
| 6 months ago | 2026-01-31 | 93.9 | 82.58 | 65,043 | 64,970 | 69,186 | 9,848 |
| 1 year ago | 2025-07-31 | 90.4 | 82.33 | 62,610 | 62,537 | 69,186 | 9,618 |
*
Percent Full is based on Conservation Storage and Conservation Capacity and doesn't account for storage in flood pool.
**
Values above, including today's are averaged conditions. For near real-time instantaneous water level, see table below or the interactive map viewer.
Most Recent Instantaneous Water Level
| Date/time |
Water Level (ft) |
Conservation Pool Elevation (ft) |
Height Above Conservation Pool (ft) |
|
|---|---|---|---|---|
| Most recent | 2026-07-31 15:00 | 82.70 | 83.00 | -0.30 |
| 1 hour prior | 2026-07-31 14:00 | 82.73 | 83.00 | -0.27 |
| 2 hours prior | 2026-07-31 13:00 | 82.74 | 83.00 | -0.26 |
| 6 hours prior | 2026-07-31 09:00 | 82.79 | 83.00 | -0.21 |
| 12 hours prior | 2026-07-31 03:00 | 82.83 | 83.00 | -0.17 |
| 24 hours prior | 2026-07-30 15:00 | 82.67 | 83.00 | -0.33 |
| 48 hours prior | 2026-07-29 15:00 | 82.60 | 83.00 | -0.40 |
*
Data is provisional and subject to revision.
Additional Information
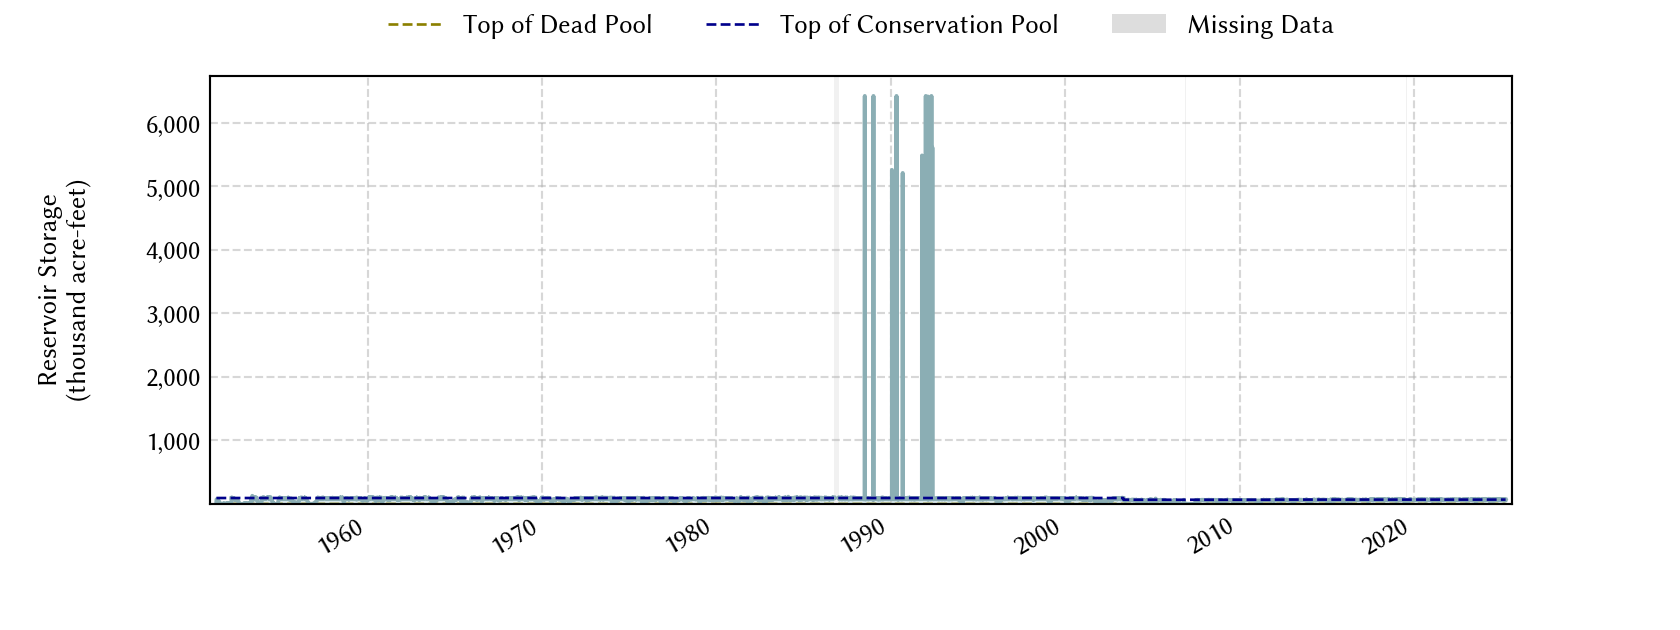
| Impoundment date | 1951-01-01 |
| Vertical datum | NGVD29 |
| Dead pool elevation | 52.00 ft above NGVD29 |
| Service spillway crest elevation | 50.00 ft above NGVD29 |
| Emergency spillway crest elevation | 85.00 ft above NGVD29 |
| Maximum design elevation | 93.31 ft above NGVD29 |
| Top of dam elevation | 95.00 ft above NGVD29 |
| Conservation pool elevation | 83.00 ft above NGVD29 |
| Data download (CSV) | period of record, last one year, last 30 days |
Elevation-Area-Capacity Curves
1951-01-01 (source: USGS)
2003-05-01 (source: TWDB)
: GIS Data
2011-10-01 (source: TWDB)
: GIS Data
|
|
| Data Source | USGS:08040000 |
| USGS Monitoring Location | USGS:08040000 |
Lake Location
