Canyon Lake: 100.0% full as of 2026-08-02
Historical Data
| Date | Percent Full |
Mean Water Level (ft) |
Reservoir Storage (acre-ft) |
Conservation Storage (acre-ft) |
Conservation Capacity (acre-ft) |
Surface Area (acres) |
|
|---|---|---|---|---|---|---|---|
| Today | 2026-08-02 | 100.0 | 910.14 | 388,317 | 378,781 | 378,781 | - n.a. - |
| Yesterday | 2026-08-01 | 100.0 | 910.11 | 388,066 | 378,781 | 378,781 | - n.a. - |
| 2 days ago | 2026-07-31 | 100.0 | 910.09 | 387,899 | 378,781 | 378,781 | - n.a. - |
| 1 week ago | 2026-07-26 | 100.0 | 909.82 | 385,645 | 378,781 | 378,781 | - n.a. - |
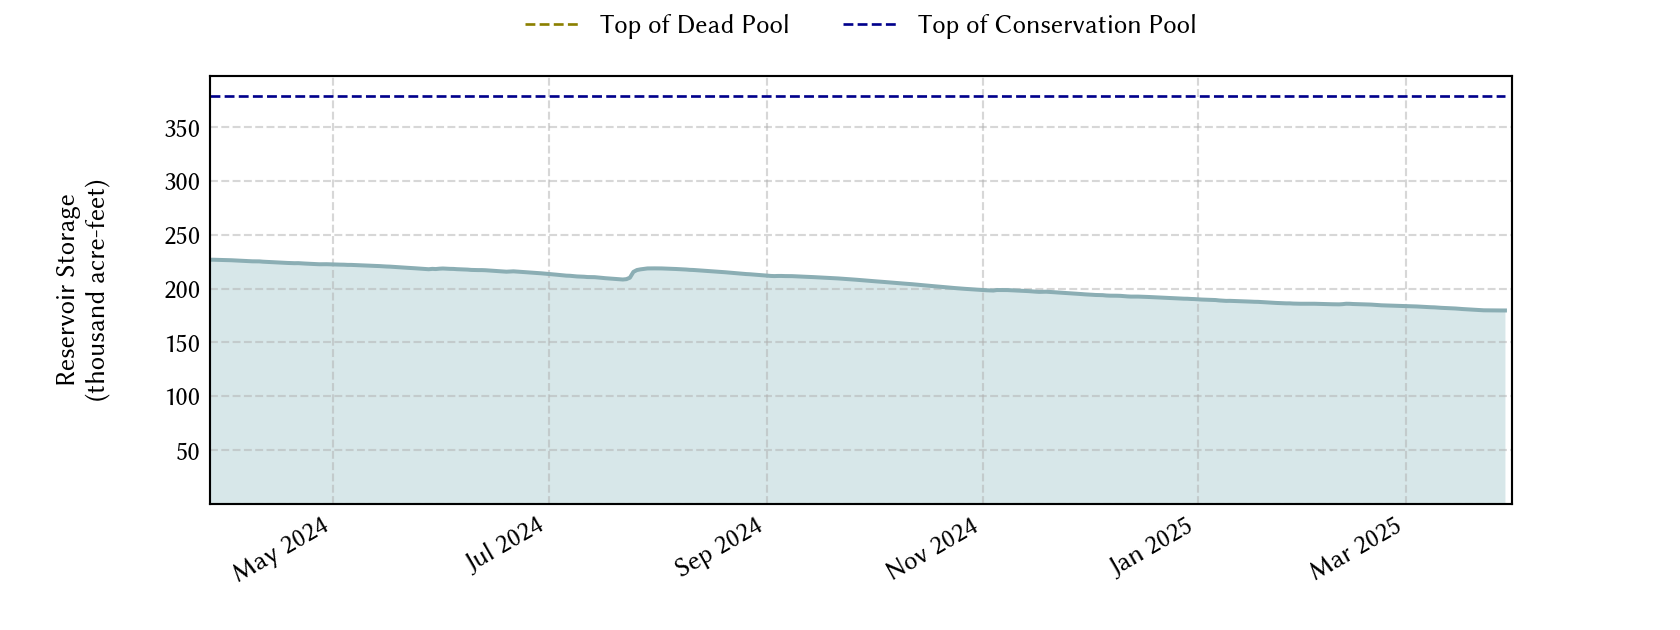
| 1 month ago | 2026-07-02 | 61.3 | 888.27 | 232,387 | 232,316 | 378,781 | 5,974 |
| 3 months ago | 2026-05-02 | 59.1 | 886.82 | 223,830 | 223,759 | 378,781 | 5,829 |
| 6 months ago | 2026-02-02 | 60.9 | 887.98 | 230,659 | 230,588 | 378,781 | 5,945 |
| 1 year ago | 2025-08-02 | 68.4 | 892.62 | 259,328 | 259,257 | 378,781 | 6,413 |
*
Percent Full is based on Conservation Storage and Conservation Capacity and doesn't account for storage in flood pool.
**
Values above, including today's are averaged conditions. For near real-time instantaneous water level, see table below or the interactive map viewer.
Most Recent Instantaneous Water Level
| Date/time |
Water Level (ft) |
Conservation Pool Elevation (ft) |
Height Above Conservation Pool (ft) |
|
|---|---|---|---|---|
| Most recent | 2026-08-02 08:15 | 910.14 | 909.00 | 1.14 |
| 1 hour prior | 2026-08-02 07:15 | 910.14 | 909.00 | 1.14 |
| 2 hours prior | 2026-08-02 06:15 | 910.14 | 909.00 | 1.14 |
| 6 hours prior | 2026-08-02 02:15 | 910.14 | 909.00 | 1.14 |
| 12 hours prior | 2026-08-01 20:15 | 910.14 | 909.00 | 1.14 |
| 24 hours prior | 2026-08-01 08:15 | 910.10 | 909.00 | 1.10 |
| 48 hours prior | 2026-07-31 08:15 | 910.08 | 909.00 | 1.08 |
*
Data is provisional and subject to revision.
Additional Information
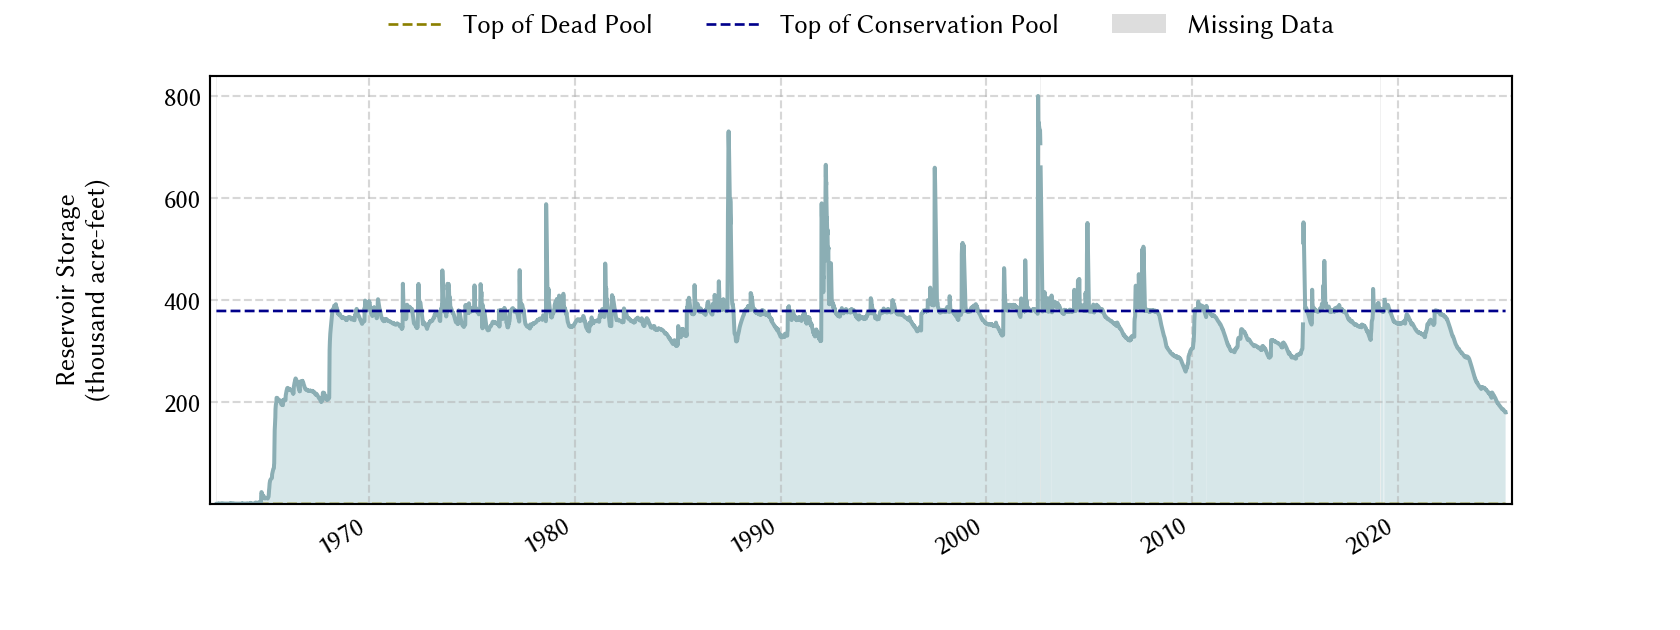
| Impoundment date | 1964-01-01 |
| Vertical datum | NGVD29 |
| Dead pool elevation | 775.00 ft above NGVD29 |
| Service spillway crest elevation | 943.00 ft above NGVD29 |
| Emergency spillway crest elevation | 943.00 ft above NGVD29 |
| Flood pool elevation | 943.00 ft above NGVD29 |
| Maximum design elevation | 969.10 ft above NGVD29 |
| Top of dam elevation | 974.00 ft above NGVD29 |
| Conservation pool elevation | 909.00 ft above NGVD29 |
| Data download (CSV) | period of record, last one year, last 30 days |
Elevation-Area-Capacity Curves
2000-11-01 (source: TWDB)
: GIS Data
|
|
| Data Source | USGS:08167700 |
| USGS Monitoring Location | USGS:08167700 |
Lake Location