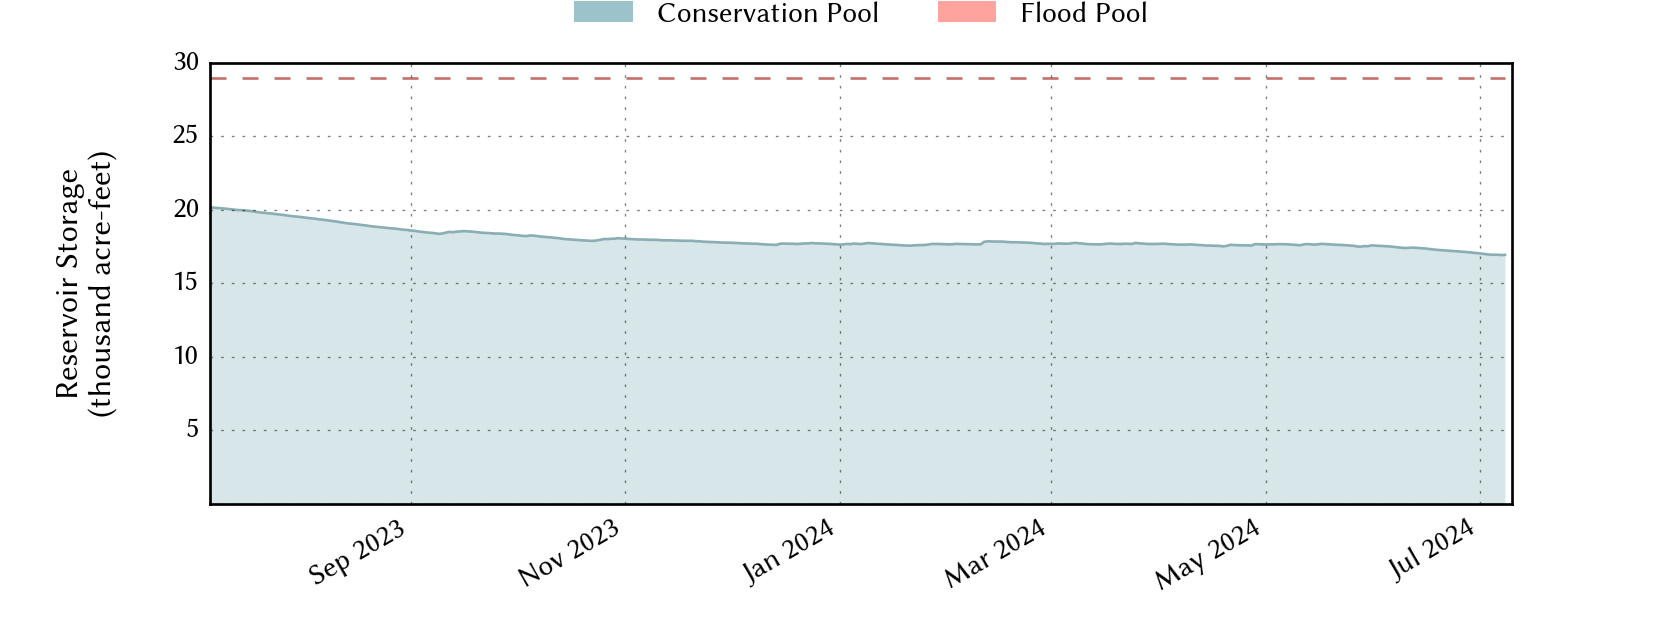
Lake Cisco: 45.8% full as of 2026-07-28
Historical Data
| Date | Percent Full |
Mean Water Level (ft) |
Reservoir Storage (acre-ft) |
Conservation Storage (acre-ft) |
Conservation Capacity (acre-ft) |
Surface Area (acres) |
|
|---|---|---|---|---|---|---|---|
| Today | 2026-07-28 | 45.8 | 1,504.66 | 13,287 | 13,287 | 29,003 | 616 |
| Yesterday | 2026-07-27 | 45.9 | 1,504.69 | 13,305 | 13,305 | 29,003 | 617 |
| 2 days ago | 2026-07-26 | 45.6 | 1,504.58 | 13,239 | 13,239 | 29,003 | 615 |
| 1 week ago | 2026-07-21 | 45.8 | 1,504.64 | 13,275 | 13,275 | 29,003 | 616 |
| 1 month ago | 2026-06-28 | 46.2 | 1,504.87 | 13,411 | 13,411 | 29,003 | 621 |
| 3 months ago | 2026-04-28 | 47.8 | 1,505.61 | 13,855 | 13,855 | 29,003 | 638 |
| 6 months ago | 2026-01-28 | 48.2 | 1,505.80 | 13,976 | 13,976 | 29,003 | 642 |
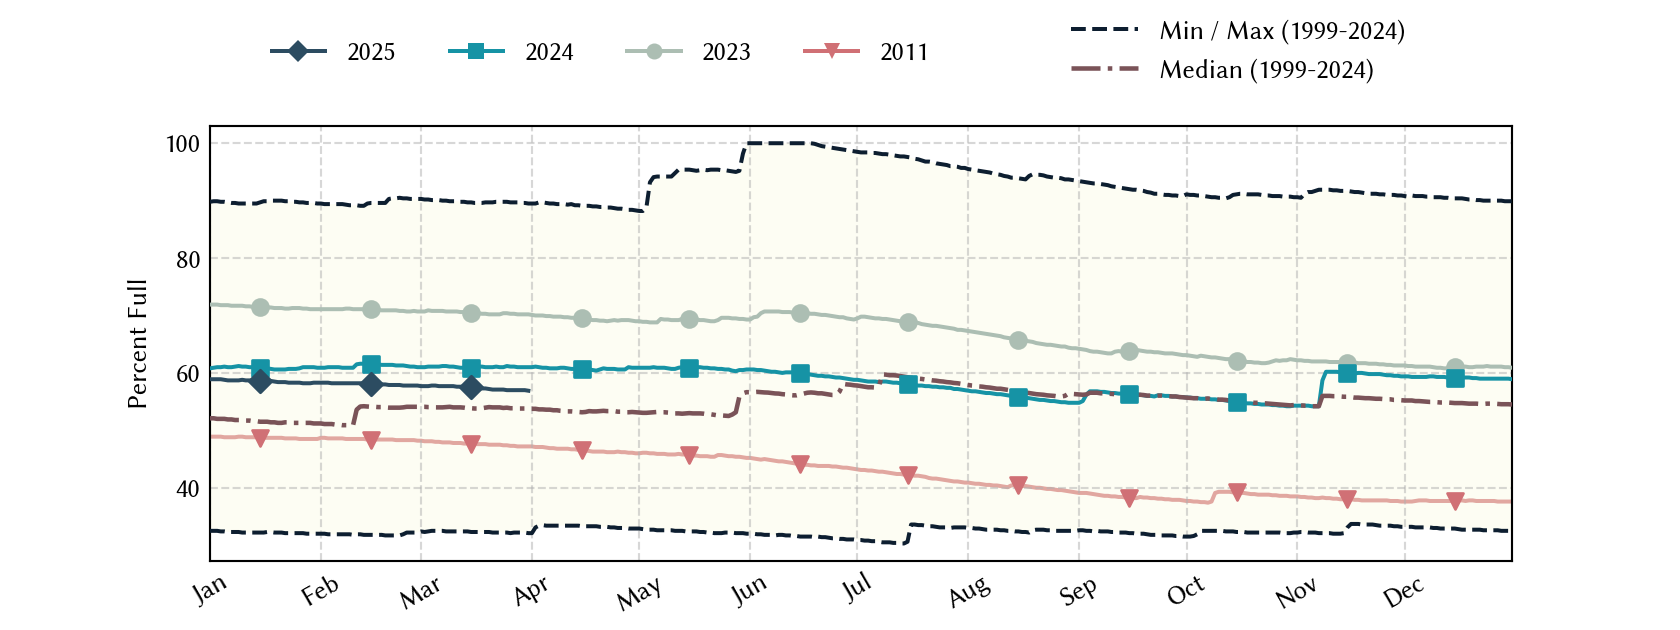
| 1 year ago | 2025-07-28 | 54.7 | 1,508.47 | 15,858 | 15,858 | 29,003 | 702 |
*
Percent Full is based on Conservation Storage and Conservation Capacity and doesn't account for storage in flood pool.
**
Values above, including today's are averaged conditions. For near real-time instantaneous water level, see table below or the interactive map viewer.
Most Recent Instantaneous Water Level
| Date/time |
Water Level (ft) |
Conservation Pool Elevation (ft) |
Height Above Conservation Pool (ft) |
|
|---|---|---|---|---|
| Most recent | 2026-07-28 15:30 | 1,504.43 | 1,522.46 | -18.03 |
| 1 hour prior | 2026-07-28 14:30 | 1,504.45 | 1,522.46 | -18.01 |
| 2 hours prior | 2026-07-28 13:30 | 1,504.45 | 1,522.46 | -18.01 |
| 6 hours prior | 2026-07-28 09:30 | 1,504.67 | 1,522.46 | -17.79 |
| 12 hours prior | 2026-07-28 03:30 | 1,504.66 | 1,522.46 | -17.80 |
| 24 hours prior | 2026-07-27 15:30 | 1,504.71 | 1,522.46 | -17.75 |
| 48 hours prior | 2026-07-26 15:30 | 1,504.58 | 1,522.46 | -17.88 |
*
Data is provisional and subject to revision.
Additional Information
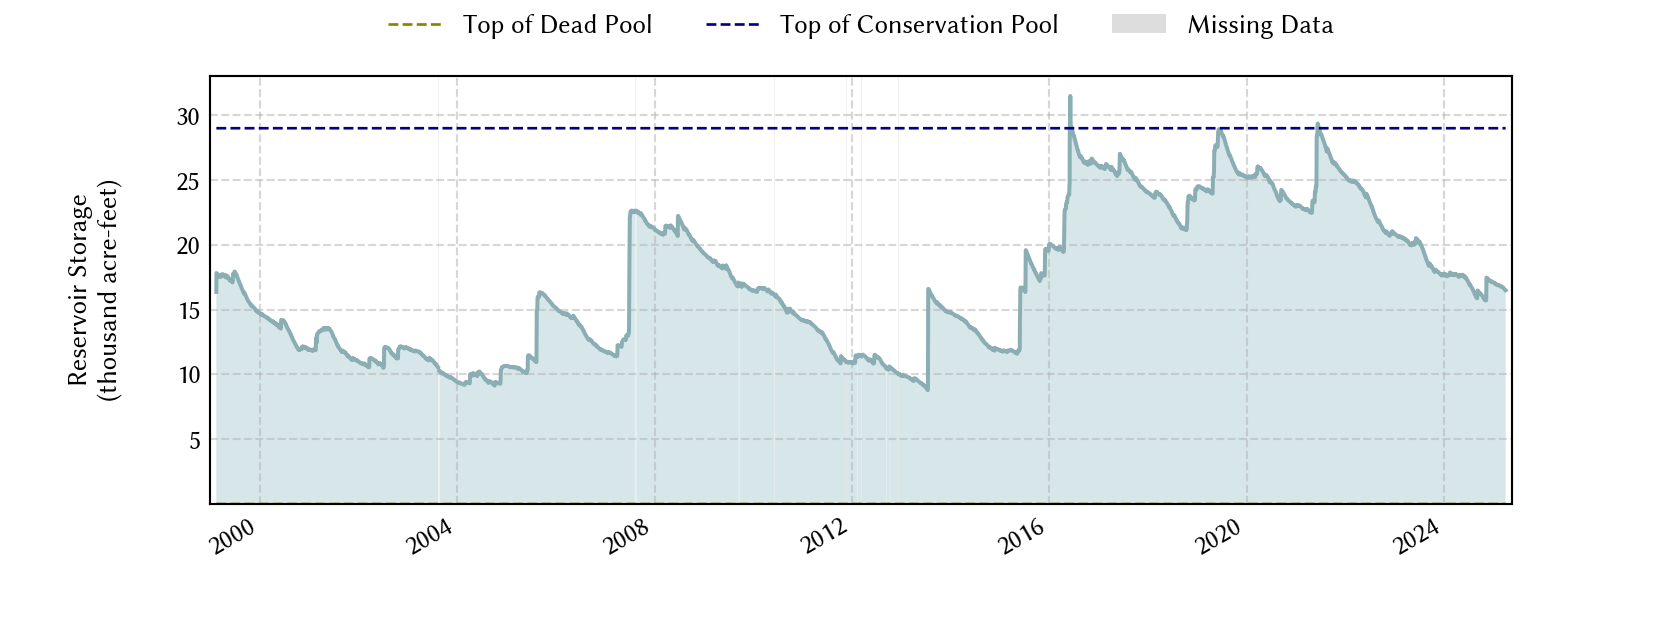
| Impoundment date | 1923-01-01 |
| Vertical datum | NGVD29 |
| Service spillway crest elevation | 1,522.46 ft above NGVD29 |
| Top of dam elevation | 1,528.50 ft above NGVD29 |
|
Conservation pool elevation |
1,522.46 ft above NGVD29 |
|
Conservation pool elevation |
1,496.00 ft above NGVD29 |
| Data download (CSV) | period of record, last one year, last 30 days |
Elevation-Area-Capacity Curves
1974-10-01 (source: TWDB)
|
|
| Data Source | USGS:08086215 |
| USGS Monitoring Location | USGS:08086215 |
Lake Location
