Lake Coleman: 84.4% full as of 2026-07-31
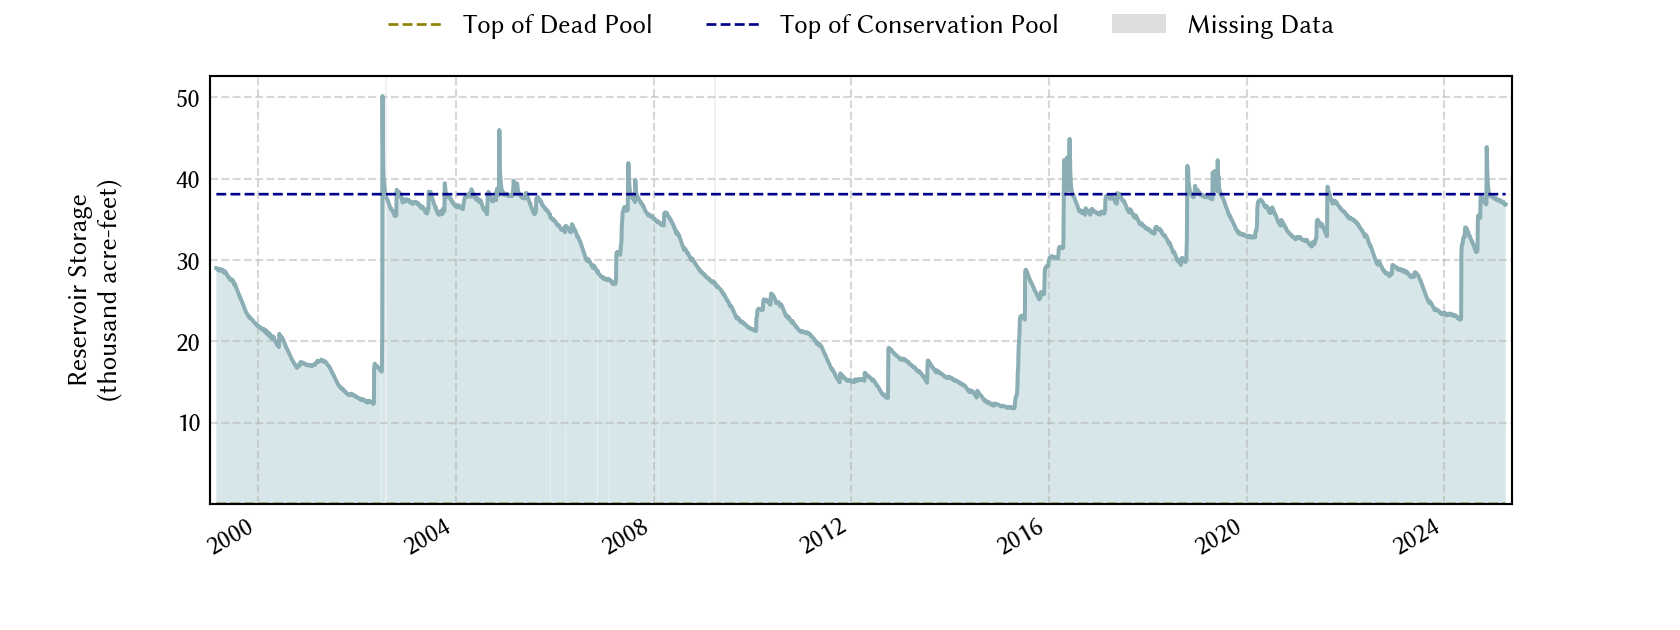
Historical Data
| Date | Percent Full |
Mean Water Level (ft) |
Reservoir Storage (acre-ft) |
Conservation Storage (acre-ft) |
Conservation Capacity (acre-ft) |
Surface Area (acres) |
|
|---|---|---|---|---|---|---|---|
| Today | 2026-07-31 | 84.4 | 1,714.12 | 32,156 | 32,138 | 38,075 | 1,695 |
| Yesterday | 2026-07-30 | 84.5 | 1,714.14 | 32,190 | 32,172 | 38,075 | 1,695 |
| 2 days ago | 2026-07-29 | 84.6 | 1,714.17 | 32,241 | 32,223 | 38,075 | 1,696 |
| 1 week ago | 2026-07-24 | 85.3 | 1,714.32 | 32,496 | 32,478 | 38,075 | 1,702 |
| 1 month ago | 2026-06-30 | 87.0 | 1,714.69 | 33,128 | 33,110 | 38,075 | 1,716 |
| 3 months ago | 2026-04-30 | 87.3 | 1,714.77 | 33,266 | 33,248 | 38,075 | 1,724 |
| 6 months ago | 2026-01-31 | 84.3 | 1,714.09 | 32,105 | 32,087 | 38,075 | 1,693 |
| 1 year ago | 2025-07-31 | 95.1 | 1,716.47 | 36,245 | 36,227 | 38,075 | 1,779 |
*
Percent Full is based on Conservation Storage and Conservation Capacity and doesn't account for storage in flood pool.
**
Values above, including today's are averaged conditions. For near real-time instantaneous water level, see table below or the interactive map viewer.
Most Recent Instantaneous Water Level
| Date/time |
Water Level (ft) |
Conservation Pool Elevation (ft) |
Height Above Conservation Pool (ft) |
|
|---|---|---|---|---|
| Most recent | 2026-07-31 19:30 | 1,714.11 | 1,717.50 | -3.39 |
| 1 hour prior | 2026-07-31 18:30 | 1,714.11 | 1,717.50 | -3.39 |
| 2 hours prior | 2026-07-31 17:30 | 1,714.11 | 1,717.50 | -3.39 |
| 6 hours prior | 2026-07-31 13:30 | 1,714.12 | 1,717.50 | -3.38 |
| 12 hours prior | 2026-07-31 07:30 | 1,714.12 | 1,717.50 | -3.38 |
| 24 hours prior | 2026-07-30 19:30 | 1,714.14 | 1,717.50 | -3.36 |
| 48 hours prior | 2026-07-29 19:30 | 1,714.17 | 1,717.50 | -3.33 |
*
Data is provisional and subject to revision.
Additional Information
| Impoundment date | 1966-01-01 |
| Vertical datum | NGVD29 |
| Dead pool elevation | 1,662.50 ft above NGVD29 |
| Service spillway crest elevation | 1,717.50 ft above NGVD29 |
| Emergency spillway crest elevation | 1,726.00 ft above NGVD29 |
| Top of dam elevation | 1,740.00 ft above NGVD29 |
| Conservation pool elevation | 1,717.50 ft above NGVD29 |
| Data download (CSV) | period of record, last one year, last 30 days |
Elevation-Area-Capacity Curves
2006-08-01 (source: TWDB)
: GIS Data
|
|
| Data Source | USGS:08140770 |
| USGS Monitoring Location | USGS:08140770 |
Lake Location