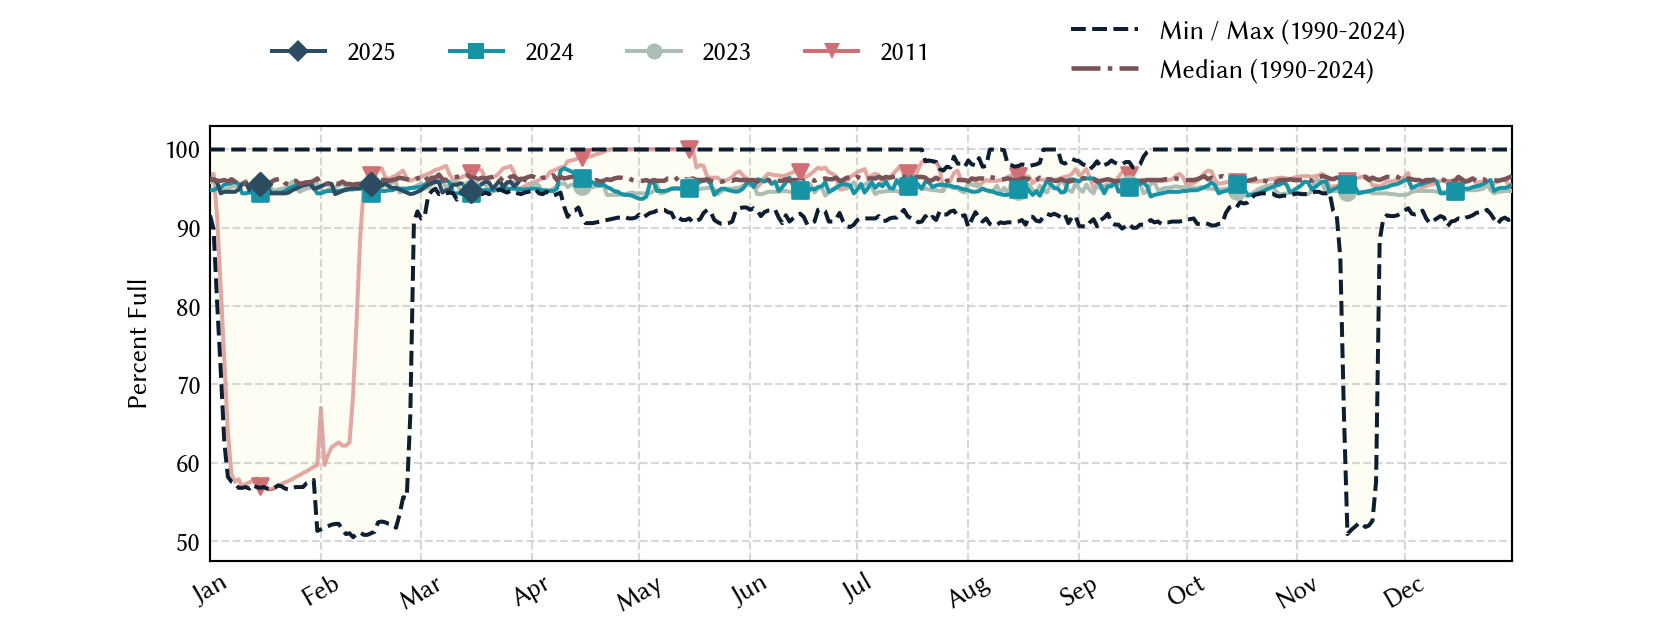
Inks Lake: 94.6% full as of 2026-08-02
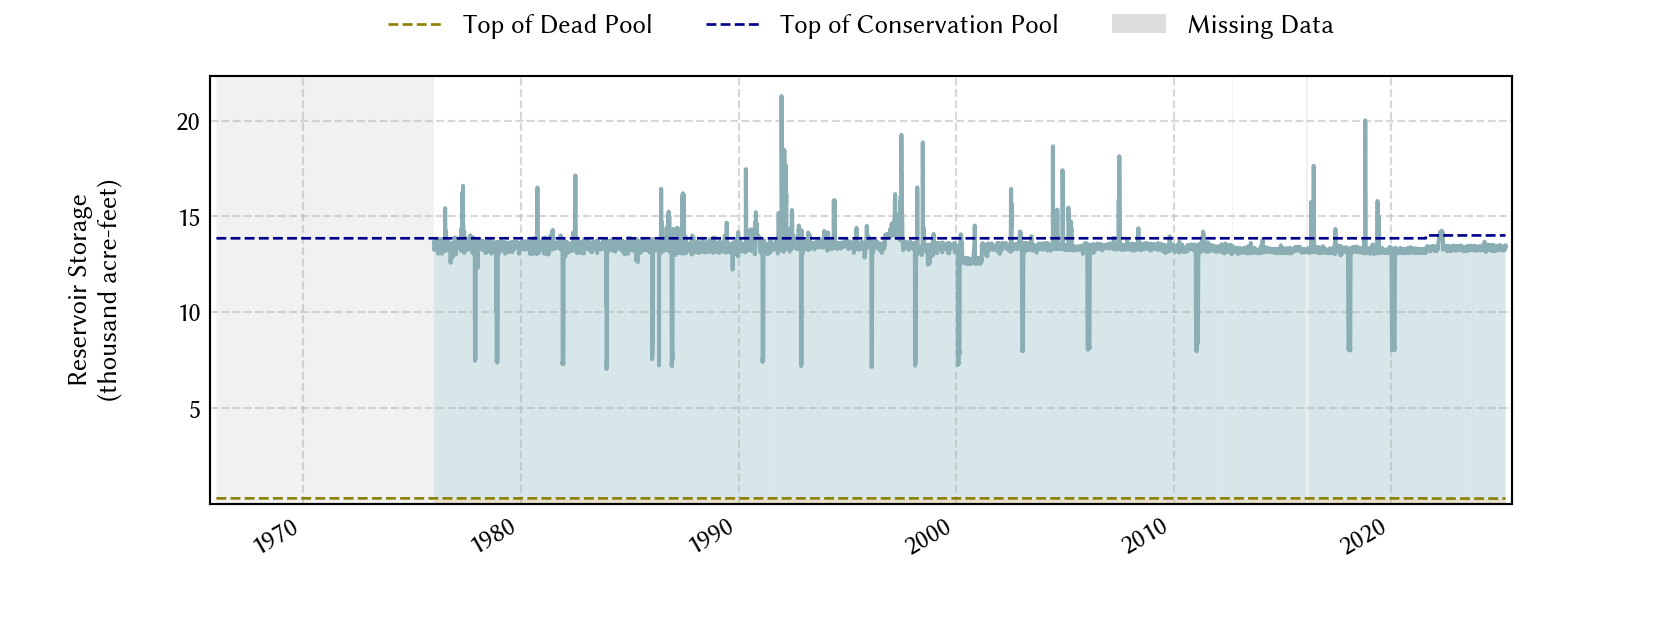
Historical Data
| Date | Percent Full |
Mean Water Level (ft) |
Reservoir Storage (acre-ft) |
Conservation Storage (acre-ft) |
Conservation Capacity (acre-ft) |
Surface Area (acres) |
|
|---|---|---|---|---|---|---|---|
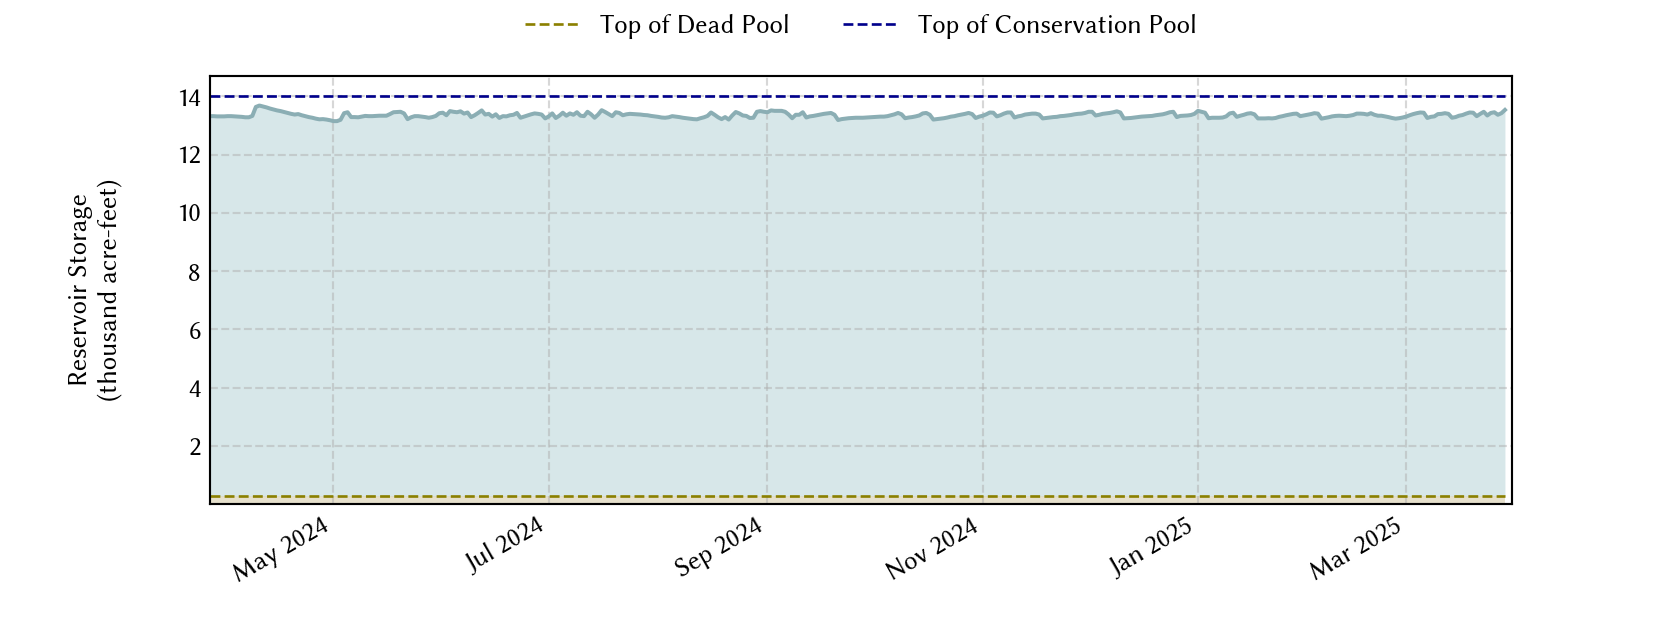
| Most recent | 2026-08-02 | 94.6 | 887.06 | 13,265 | 12,982 | 13,729 | 779 |
| 1 day prior | 2026-08-01 | 94.6 | 887.07 | 13,273 | 12,990 | 13,729 | 780 |
| 2 days prior | 2026-07-31 | 94.8 | 887.11 | 13,304 | 13,021 | 13,729 | 782 |
| 1 week prior | 2026-07-26 | 94.7 | 887.08 | 13,281 | 12,998 | 13,729 | 780 |
| 1 month prior | 2026-07-02 | 94.2 | 886.99 | 13,211 | 12,928 | 13,729 | 775 |
| 3 months prior | 2026-05-02 | 95.1 | 887.15 | 13,335 | 13,052 | 13,729 | 789 |
| 6 months prior | 2026-02-02 | 95.5 | 887.22 | 13,391 | 13,108 | 13,729 | 790 |
| 1 year prior | 2025-08-02 | 94.8 | 887.11 | 13,304 | 13,021 | 13,729 | 782 |
*
Percent Full is based on Conservation Storage and Conservation Capacity and doesn't account for storage in flood pool.
**
Values above, including today's are averaged conditions. For near real-time instantaneous water level, see table below or the interactive map viewer.
Most Recent Instantaneous Water Level
| Date/time |
Water Level (ft) |
Conservation Pool Elevation (ft) |
Height Above Conservation Pool (ft) |
|
|---|---|---|---|---|
| Most recent | 2026-08-02 23:30 | 887.04 | 888.00 | -0.96 |
| 1 hour prior | 2026-08-02 22:30 | 887.04 | 888.00 | -0.96 |
| 2 hours prior | 2026-08-02 21:30 | 887.04 | 888.00 | -0.96 |
| 6 hours prior | 2026-08-02 17:30 | 887.04 | 888.00 | -0.96 |
| 12 hours prior | 2026-08-02 11:30 | 887.06 | 888.00 | -0.94 |
| 24 hours prior | 2026-08-01 23:30 | 887.06 | 888.00 | -0.94 |
| 48 hours prior | 2026-07-31 23:30 | 887.09 | 888.00 | -0.91 |
*
Data is provisional and subject to revision.
Additional Information
| Impoundment date | 1938-01-01 |
| Vertical datum | NAVD88 +0.31 |
| Dead pool elevation | 844.50 ft above NAVD88 +0.31 |
| Emergency spillway crest elevation | 888.32 ft above NAVD88 +0.31 |
| Top of dam elevation | 922.00 ft above NAVD88 +0.31 |
| Conservation pool elevation | 888.00 ft above NAVD88 +0.31 |
| Data download (CSV) | period of record, last one year, last 30 days |
Elevation-Area-Capacity Curves
2007-04-01 (source: TWDB)
: GIS Data
2021-08-01 (source: TWDB)
: GIS Data
|
|
| Data Source | LCRA:1999 |
Lake Location