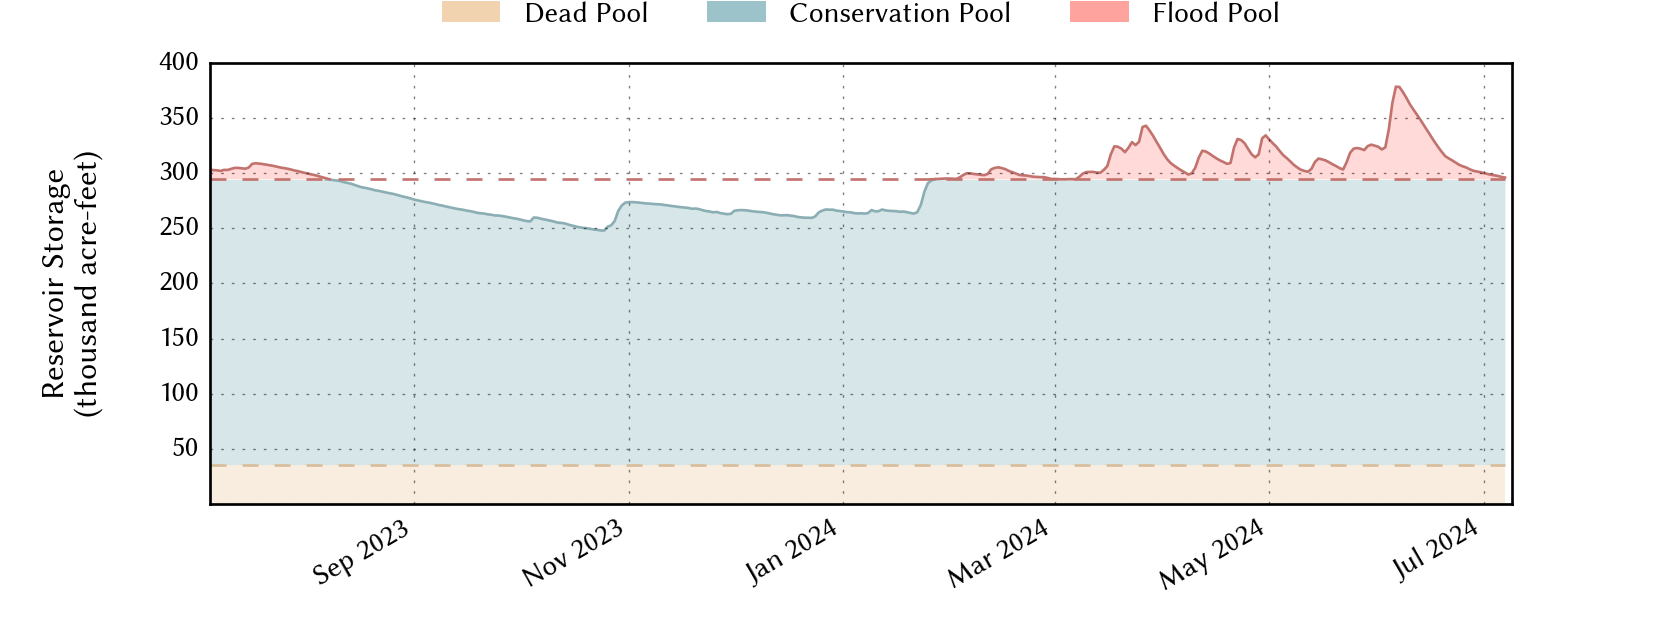
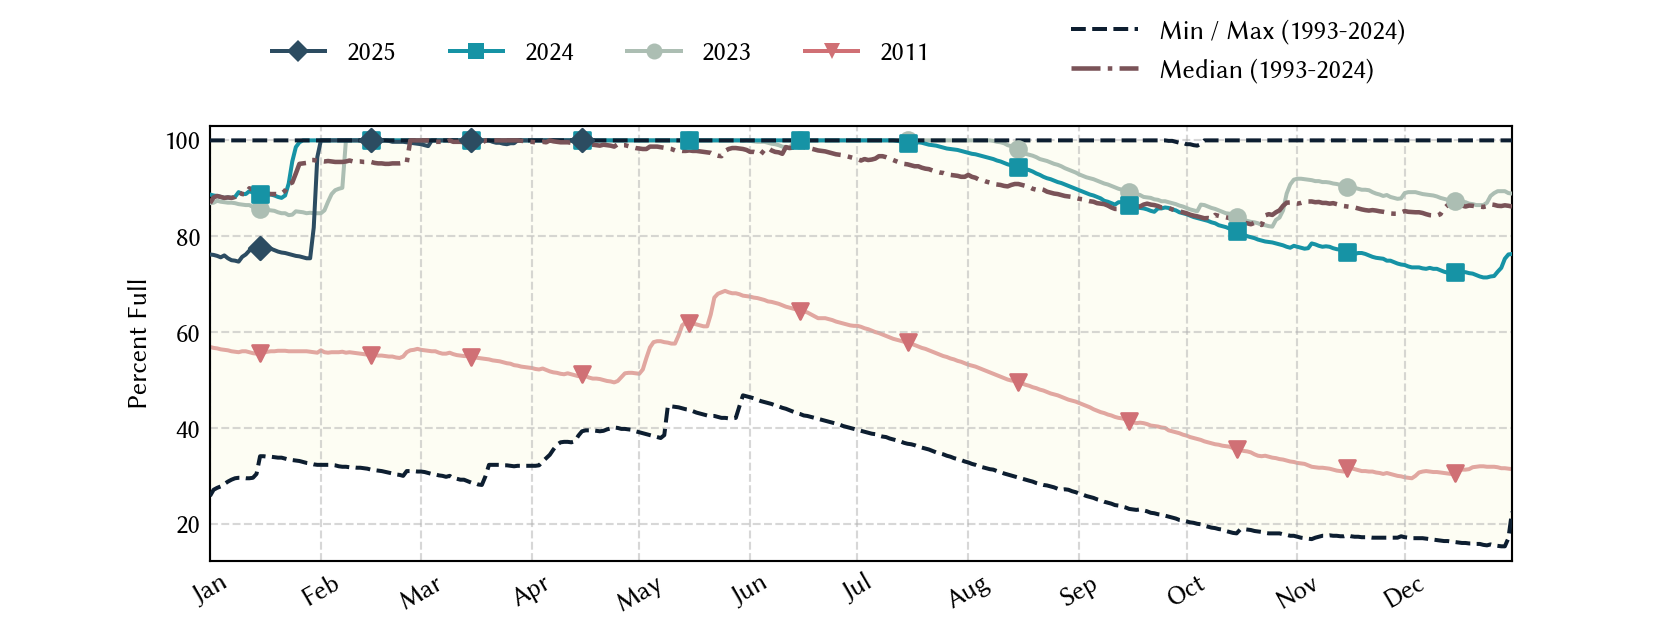
Cooper (Chapman) Lake: 84.3% full as of 2026-08-01
Historical Data
| Date | Percent Full |
Mean Water Level (ft) |
Reservoir Storage (acre-ft) |
Conservation Storage (acre-ft) |
Conservation Capacity (acre-ft) |
Surface Area (acres) |
|
|---|---|---|---|---|---|---|---|
| Today | 2026-08-01 | 84.3 | 437.66 | 253,957 | 218,182 | 258,723 | 16,652 |
| Yesterday | 2026-07-31 | 84.5 | 437.69 | 254,457 | 218,682 | 258,723 | 16,669 |
| 2 days ago | 2026-07-30 | 84.7 | 437.72 | 254,958 | 219,183 | 258,723 | 16,686 |
| 1 week ago | 2026-07-25 | 85.9 | 437.91 | 258,138 | 222,363 | 258,723 | 16,796 |
| 1 month ago | 2026-07-01 | 89.2 | 438.41 | 266,608 | 230,833 | 258,723 | 17,083 |
| 3 months ago | 2026-05-01 | 80.8 | 437.11 | 244,886 | 209,111 | 258,723 | 16,335 |
| 6 months ago | 2026-02-01 | 69.4 | 435.24 | 215,413 | 179,638 | 258,723 | 15,119 |
| 1 year ago | 2025-08-01 | 97.5 | 439.64 | 288,056 | 252,281 | 258,723 | 17,791 |
*
Percent Full is based on Conservation Storage and Conservation Capacity and doesn't account for storage in flood pool.
**
Values above, including today's are averaged conditions. For near real-time instantaneous water level, see table below or the interactive map viewer.
Most Recent Instantaneous Water Level
| Date/time |
Water Level (ft) |
Conservation Pool Elevation (ft) |
Height Above Conservation Pool (ft) |
|
|---|---|---|---|---|
| Most recent | 2026-08-01 15:00 | 437.65 | 440.00 | -2.35 |
| 1 hour prior | 2026-08-01 14:00 | 437.66 | 440.00 | -2.34 |
| 2 hours prior | 2026-08-01 13:00 | 437.65 | 440.00 | -2.35 |
| 6 hours prior | 2026-08-01 09:00 | 437.65 | 440.00 | -2.35 |
| 12 hours prior | 2026-08-01 03:00 | 437.68 | 440.00 | -2.32 |
| 24 hours prior | 2026-07-31 15:00 | 437.69 | 440.00 | -2.31 |
| 48 hours prior | 2026-07-30 15:00 | 437.71 | 440.00 | -2.29 |
*
Data is provisional and subject to revision.
Additional Information
| Impoundment date | 1991-01-01 |
| Vertical datum | NGVD29 |
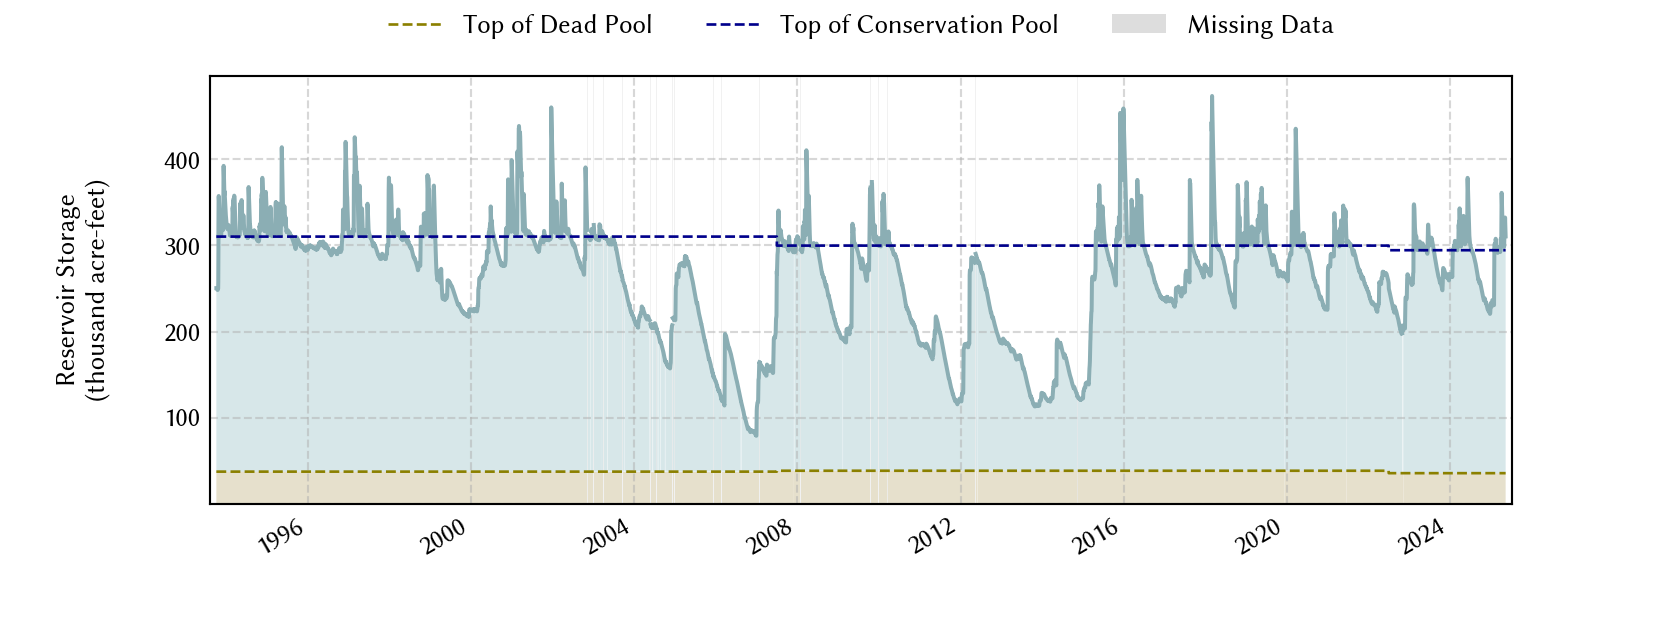
| Dead pool elevation | 415.50 ft above NGVD29 |
| Emergency spillway crest elevation | 446.20 ft above NGVD29 |
| Flood pool elevation | 446.20 ft above NGVD29 |
| Maximum design elevation | 459.50 ft above NGVD29 |
| Top of dam elevation | 464.50 ft above NGVD29 |
| Conservation pool elevation | 440.00 ft above NGVD29 |
| Data download (CSV) | period of record, last one year, last 30 days |
Elevation-Area-Capacity Curves
1991-01-01 (source: USGS)
2007-07-01 (source: TWDB)
: GIS Data
2022-07-01 (source: TWDB)
: GIS Data
|
|
| Data Source | USGS:07342495 |
| USGS Monitoring Location | USGS:07342495 |
Lake Location
