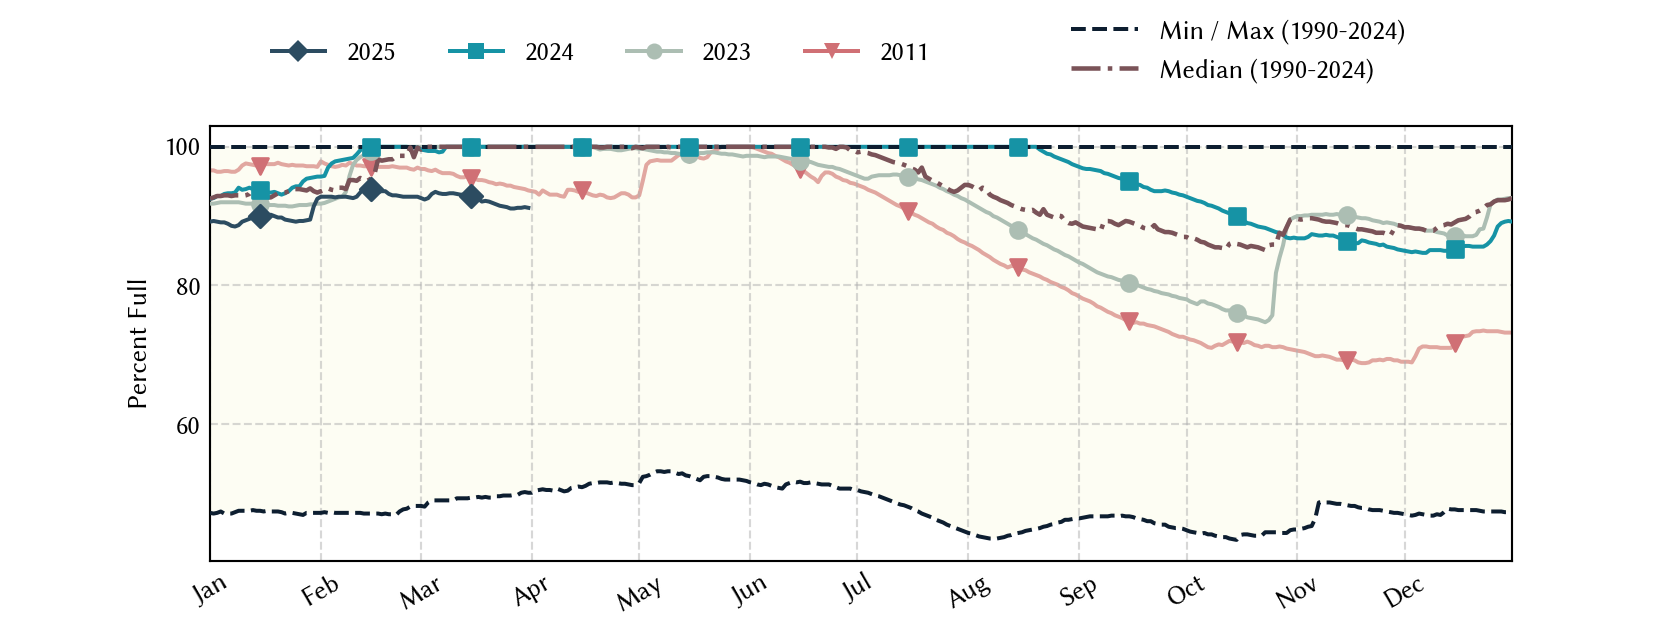
Lewisville Lake: 97.6% full as of 2026-07-30
Historical Data
| Date | Percent Full |
Mean Water Level (ft) |
Reservoir Storage (acre-ft) |
Conservation Storage (acre-ft) |
Conservation Capacity (acre-ft) |
Surface Area (acres) |
|
|---|---|---|---|---|---|---|---|
| Today | 2026-07-30 | 97.6 | 521.50 | 585,483 | 549,809 | 563,228 | 26,654 |
| Yesterday | 2026-07-29 | 97.8 | 521.54 | 586,550 | 550,876 | 563,228 | 26,682 |
| 2 days ago | 2026-07-28 | 98.0 | 521.58 | 587,618 | 551,944 | 563,228 | 26,709 |
| 1 week ago | 2026-07-23 | 99.1 | 521.81 | 593,780 | 558,106 | 563,228 | 26,878 |
| 1 month ago | 2026-06-30 | 100.0 | 523.34 | 635,720 | 563,228 | 563,228 | - n.a. - |
| 3 months ago | 2026-04-30 | 100.0 | 522.18 | 603,774 | 563,228 | 563,228 | - n.a. - |
| 6 months ago | 2026-01-30 | 97.5 | 521.47 | 584,685 | 549,011 | 563,228 | 26,635 |
| 1 year ago | 2025-07-30 | 97.5 | 521.48 | 584,951 | 549,277 | 563,228 | 26,641 |
*
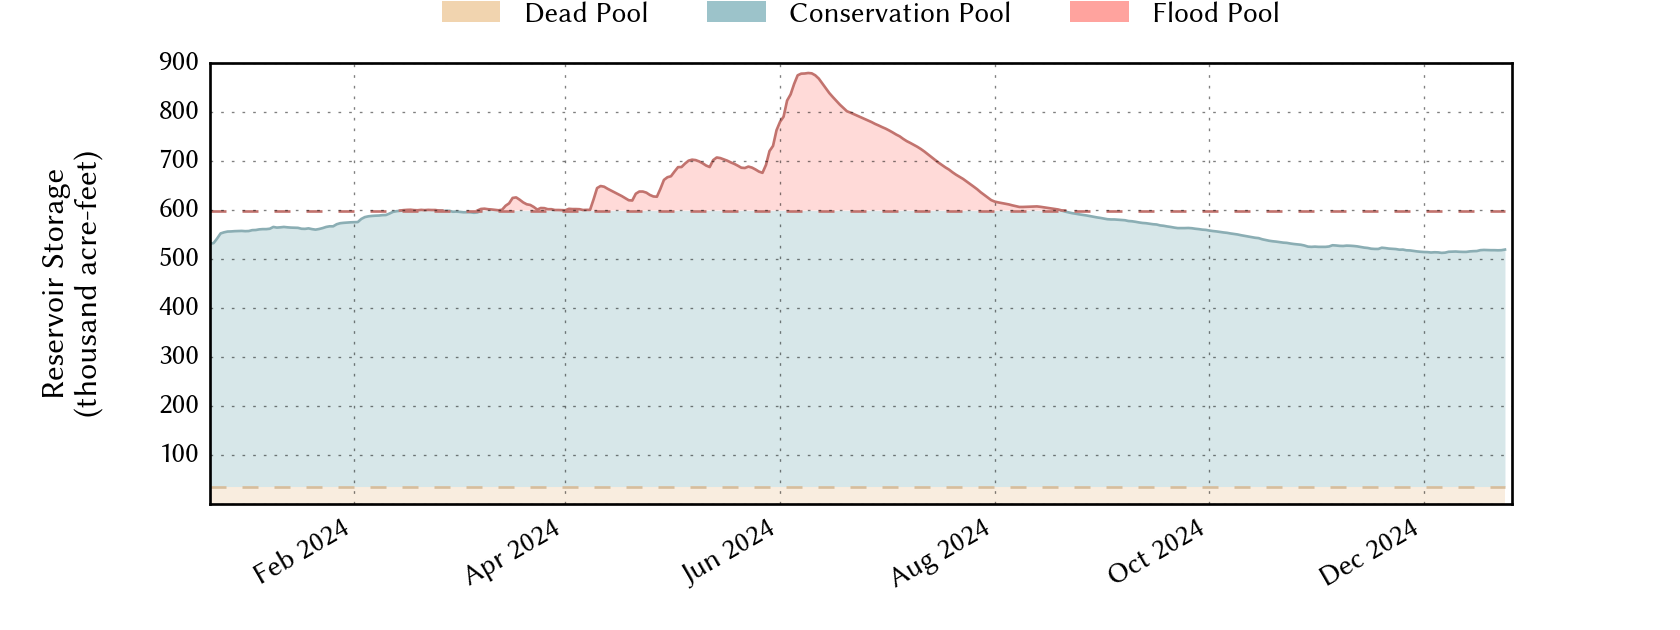
Percent Full is based on Conservation Storage and Conservation Capacity and doesn't account for storage in flood pool.
**
Values above, including today's are averaged conditions. For near real-time instantaneous water level, see table below or the interactive map viewer.
Most Recent Instantaneous Water Level
| Date/time |
Water Level (ft) |
Conservation Pool Elevation (ft) |
Height Above Conservation Pool (ft) |
|
|---|---|---|---|---|
| Most recent | 2026-07-30 20:15 | 521.48 | 522.00 | -0.52 |
| 1 hour prior | 2026-07-30 19:15 | 521.47 | 522.00 | -0.53 |
| 2 hours prior | 2026-07-30 18:15 | 521.48 | 522.00 | -0.52 |
| 6 hours prior | 2026-07-30 14:15 | 521.47 | 522.00 | -0.53 |
| 12 hours prior | 2026-07-30 08:15 | 521.51 | 522.00 | -0.49 |
| 24 hours prior | 2026-07-29 20:15 | 521.53 | 522.00 | -0.47 |
| 48 hours prior | 2026-07-28 20:15 | 521.58 | 522.00 | -0.42 |
*
Data is provisional and subject to revision.
Additional Information
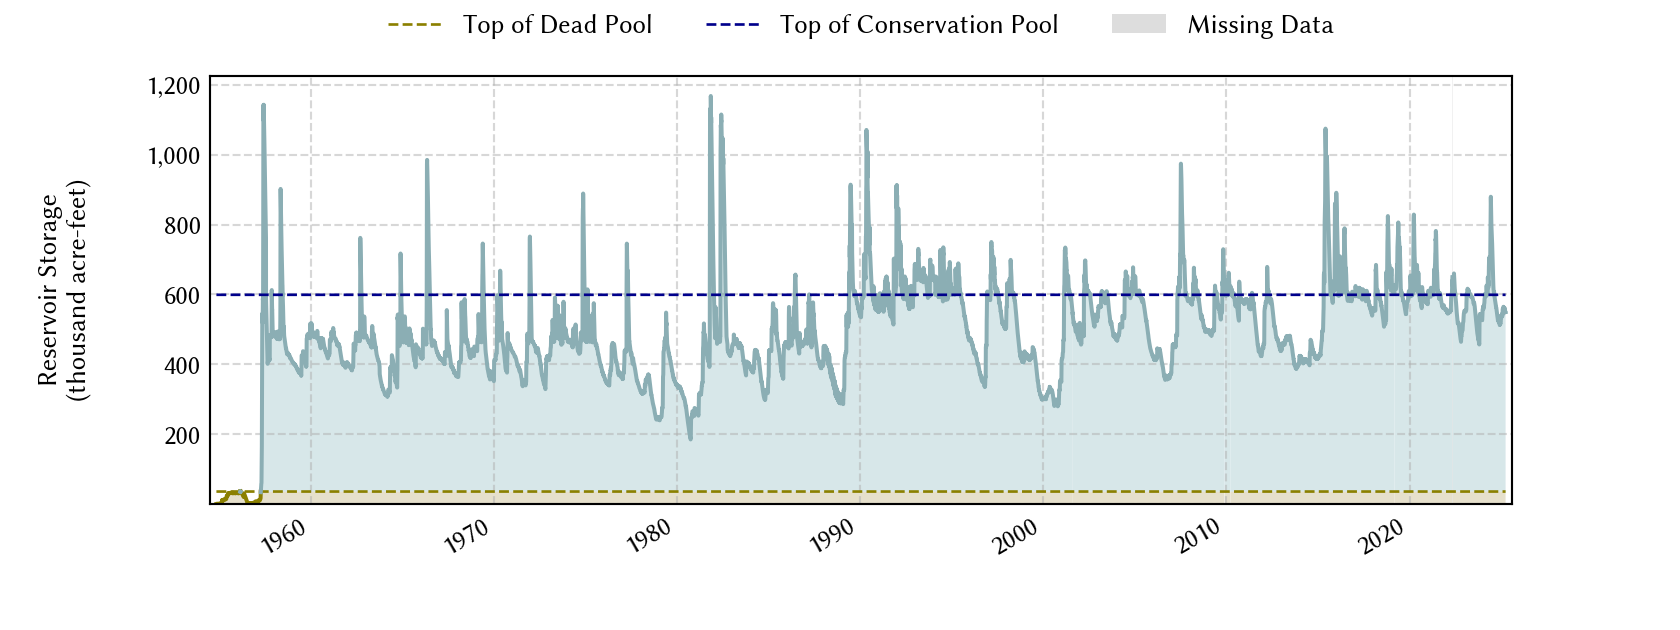
| Impoundment date | 1955-01-01 |
| Vertical datum | NGVD29 |
| Dead pool elevation | 481.00 ft above NGVD29 |
| Emergency spillway crest elevation | 532.00 ft above NGVD29 |
| Flood pool elevation | 532.00 ft above NGVD29 |
| Maximum design elevation | 552.14 ft above NGVD29 |
| Maximum design elevation | 553.00 ft above NGVD29 |
| Top of dam elevation | 560.00 ft above NGVD29 |
| Conservation pool elevation | 522.00 ft above NGVD29 |
| Data download (CSV) | period of record, last one year, last 30 days |
Elevation-Area-Capacity Curves
2007-09-01 (source: TWDB)
: GIS Data
|
|
| Data Source | USGS:08052800 |
| USGS Monitoring Location | USGS:08052800 |
Lake Location