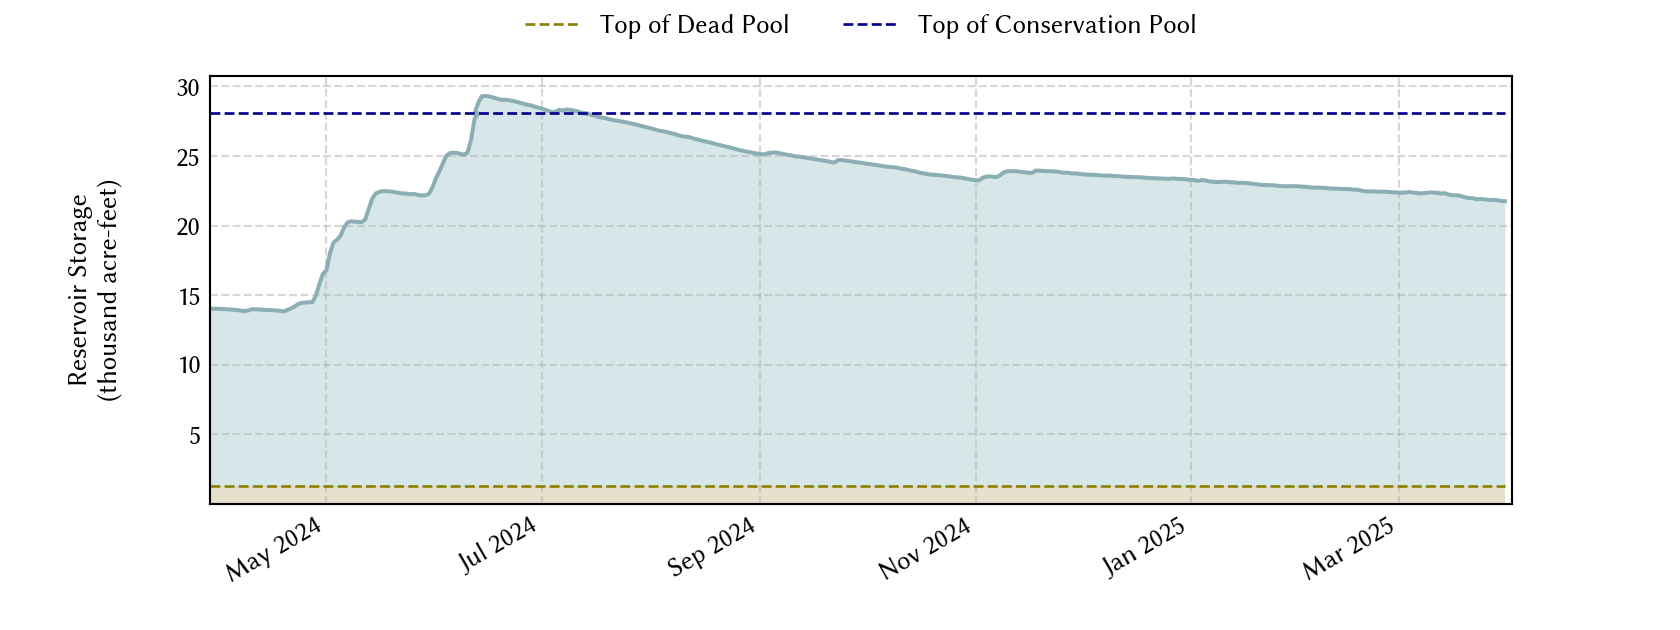
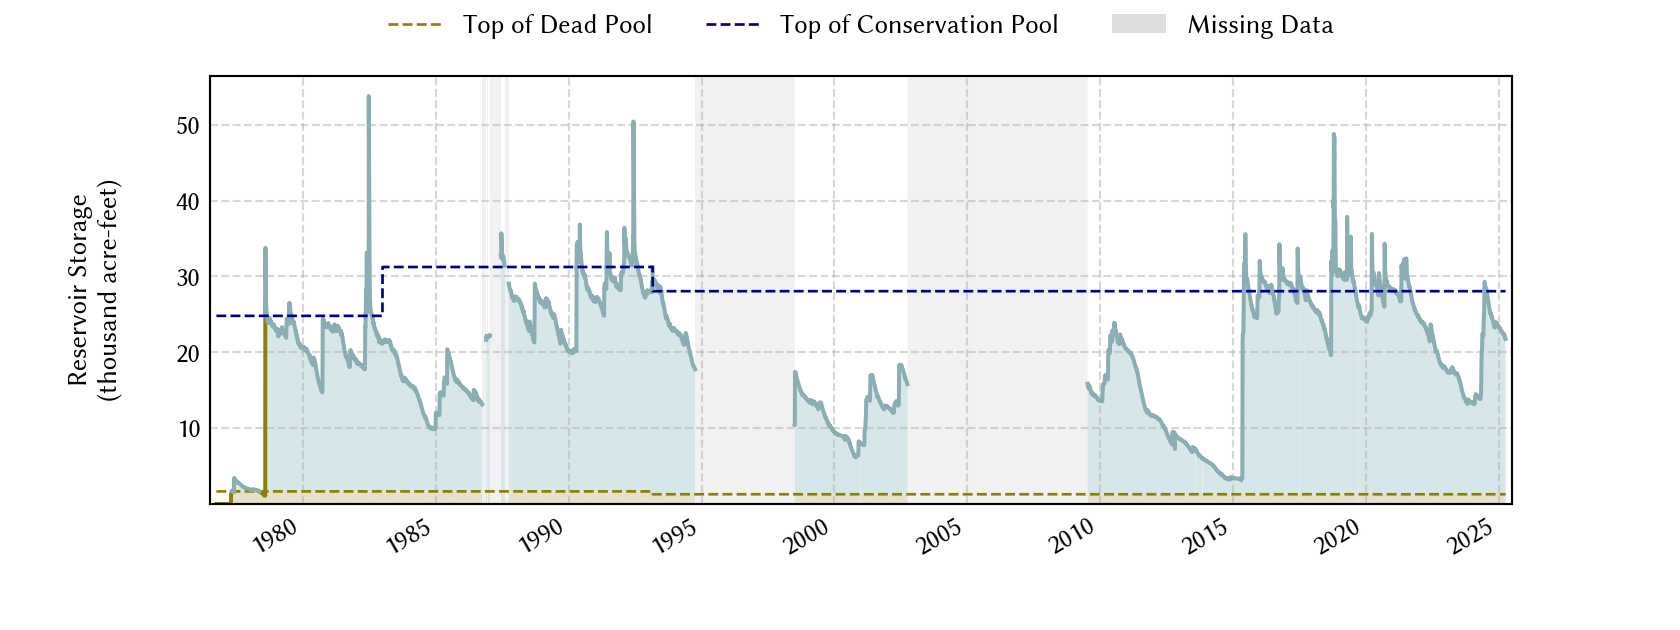
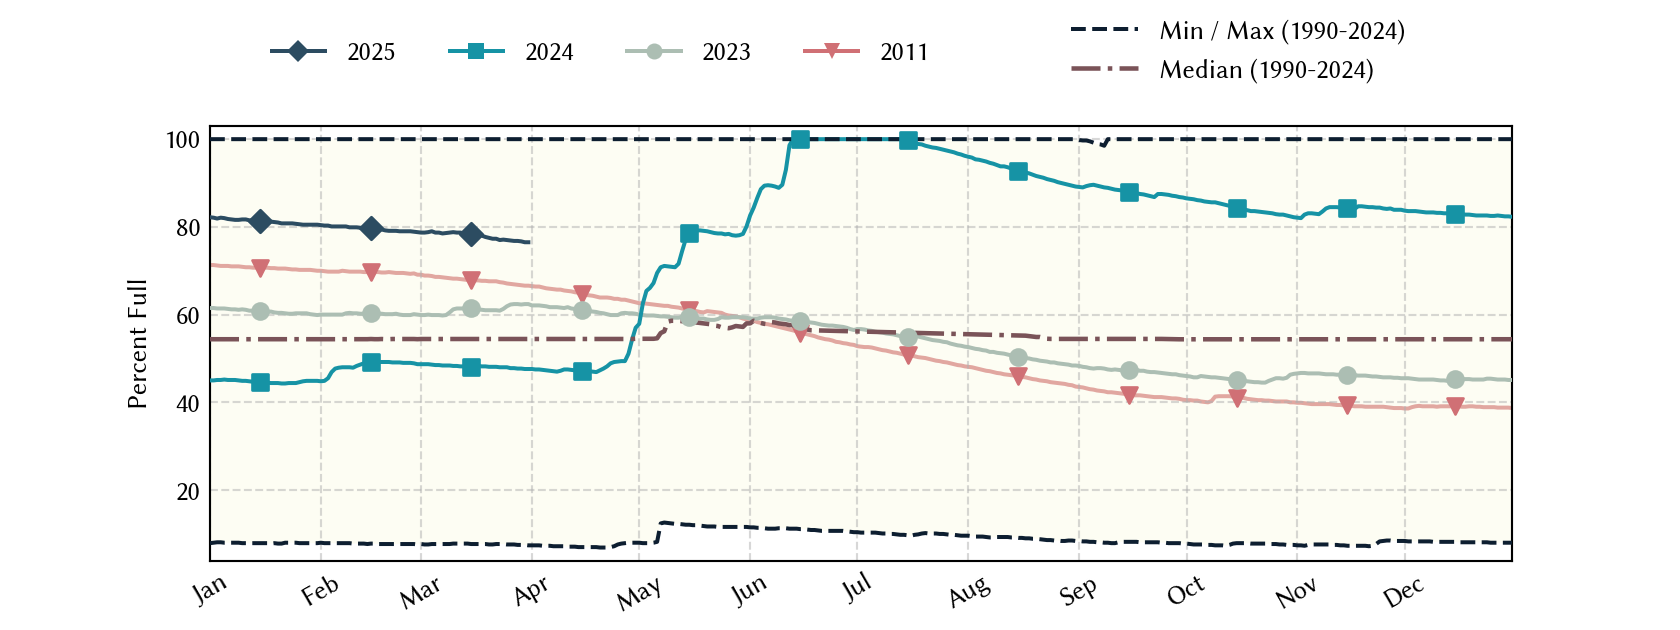
Millers Creek Reservoir: 66.7% full as of 2026-07-28
Historical Data
| Date | Percent Full |
Mean Water Level (ft) |
Reservoir Storage (acre-ft) |
Conservation Storage (acre-ft) |
Conservation Capacity (acre-ft) |
Surface Area (acres) |
|
|---|---|---|---|---|---|---|---|
| Today | 2026-07-28 | 66.7 | 1,329.27 | 19,147 | 17,864 | 26,768 | 1,537 |
| Yesterday | 2026-07-27 | 66.9 | 1,329.29 | 19,178 | 17,895 | 26,768 | 1,539 |
| 2 days ago | 2026-07-26 | 67.1 | 1,329.33 | 19,239 | 17,956 | 26,768 | 1,543 |
| 1 week ago | 2026-07-21 | 67.4 | 1,329.38 | 19,317 | 18,034 | 26,768 | 1,547 |
| 1 month ago | 2026-06-28 | 64.9 | 1,328.95 | 18,660 | 17,377 | 26,768 | 1,508 |
| 3 months ago | 2026-04-28 | 66.3 | 1,329.19 | 19,024 | 17,741 | 26,768 | 1,530 |
| 6 months ago | 2026-01-28 | 71.5 | 1,330.08 | 20,425 | 19,142 | 26,768 | 1,620 |
| 1 year ago | 2025-07-28 | 87.4 | 1,332.40 | 24,665 | 23,382 | 26,768 | 2,018 |
*
Percent Full is based on Conservation Storage and Conservation Capacity and doesn't account for storage in flood pool.
**
Values above, including today's are averaged conditions. For near real-time instantaneous water level, see table below or the interactive map viewer.
Most Recent Instantaneous Water Level
| Date/time |
Water Level (ft) |
Conservation Pool Elevation (ft) |
Height Above Conservation Pool (ft) |
|
|---|---|---|---|---|
| Most recent | 2026-07-28 15:00 | 1,329.26 | 1,334.00 | -4.74 |
| 1 hour prior | 2026-07-28 14:00 | 1,329.27 | 1,334.00 | -4.73 |
| 2 hours prior | 2026-07-28 13:00 | 1,329.26 | 1,334.00 | -4.74 |
| 6 hours prior | 2026-07-28 09:00 | 1,329.27 | 1,334.00 | -4.73 |
| 12 hours prior | 2026-07-28 03:00 | 1,329.27 | 1,334.00 | -4.73 |
| 24 hours prior | 2026-07-27 15:00 | 1,329.29 | 1,334.00 | -4.71 |
| 48 hours prior | 2026-07-26 15:00 | 1,329.32 | 1,334.00 | -4.68 |
*
Data is provisional and subject to revision.
Additional Information
| Impoundment date | 1974-01-01 |
| Vertical datum | NGVD29 |
| Dead pool elevation | 1,305.00 ft above NGVD29 |
| Service spillway crest elevation | 1,331.00 ft above NGVD29 |
| Emergency spillway crest elevation | 1,340.00 ft above NGVD29 |
| Top of dam elevation | 1,355.00 ft above NGVD29 |
|
Conservation pool elevation |
1,334.00 ft above NGVD29 |
|
Conservation pool elevation |
1,331.00 ft above NGVD29 |
| Data download (CSV) | period of record, last one year, last 30 days |
| Data Source | USGS:08082800 |
| USGS Monitoring Location | USGS:08082800 |
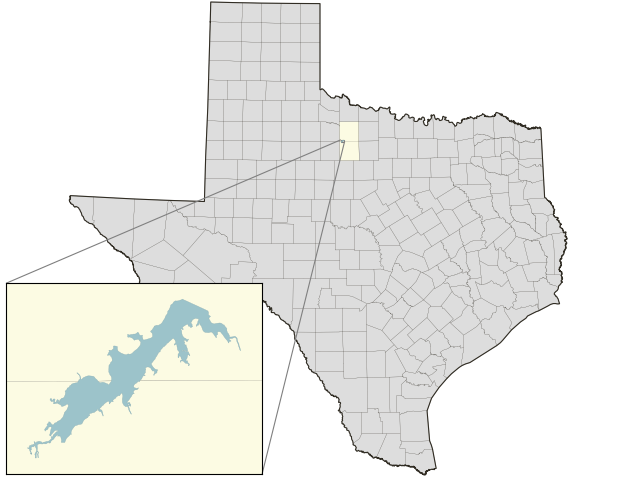
Lake Location