Lake Nasworthy: 85.8% full as of 2026-07-31
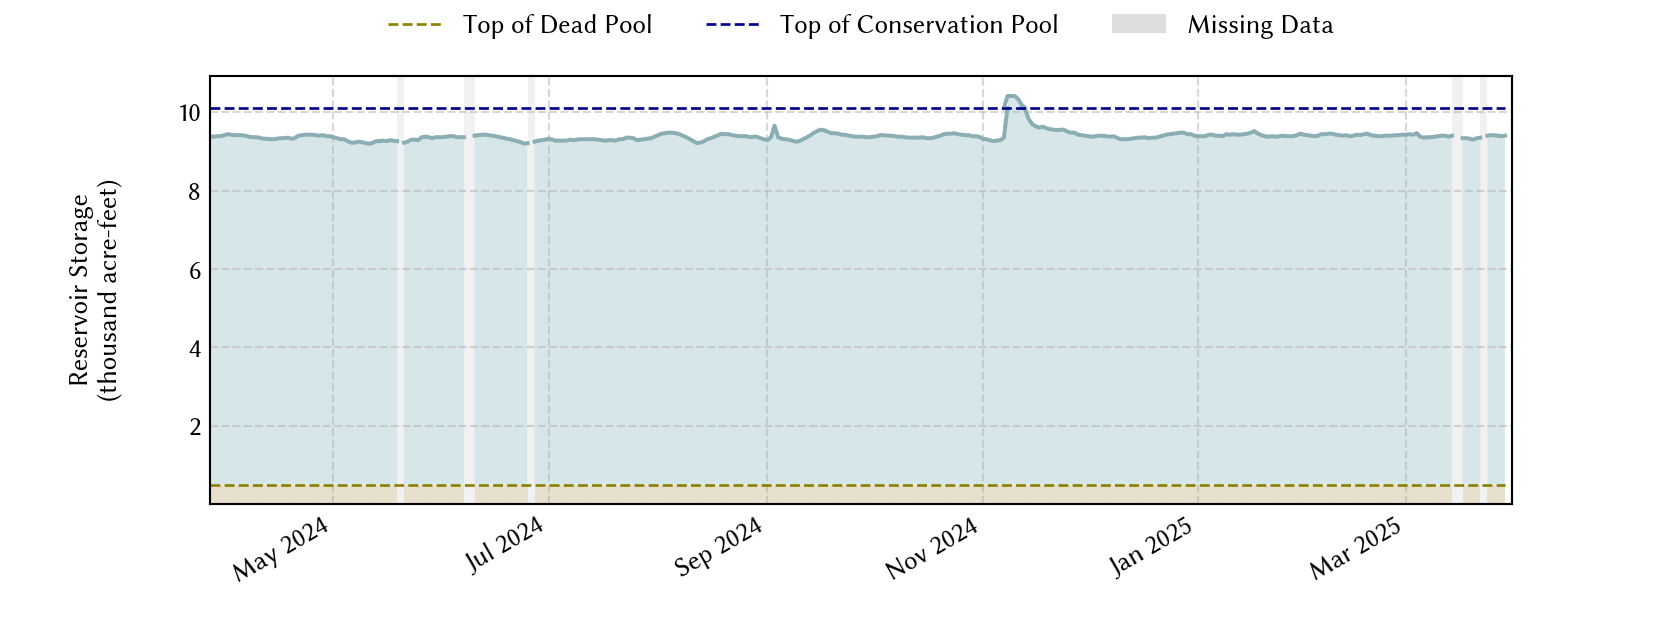
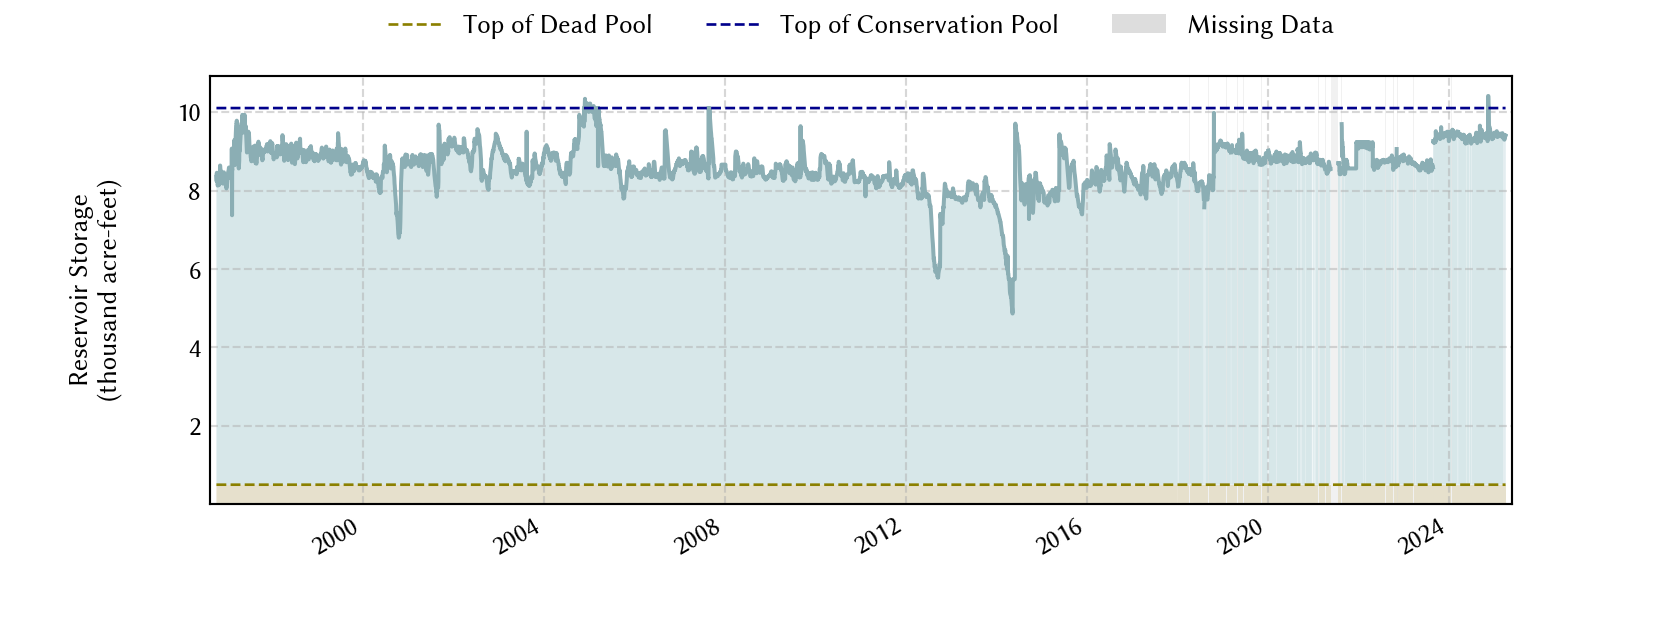
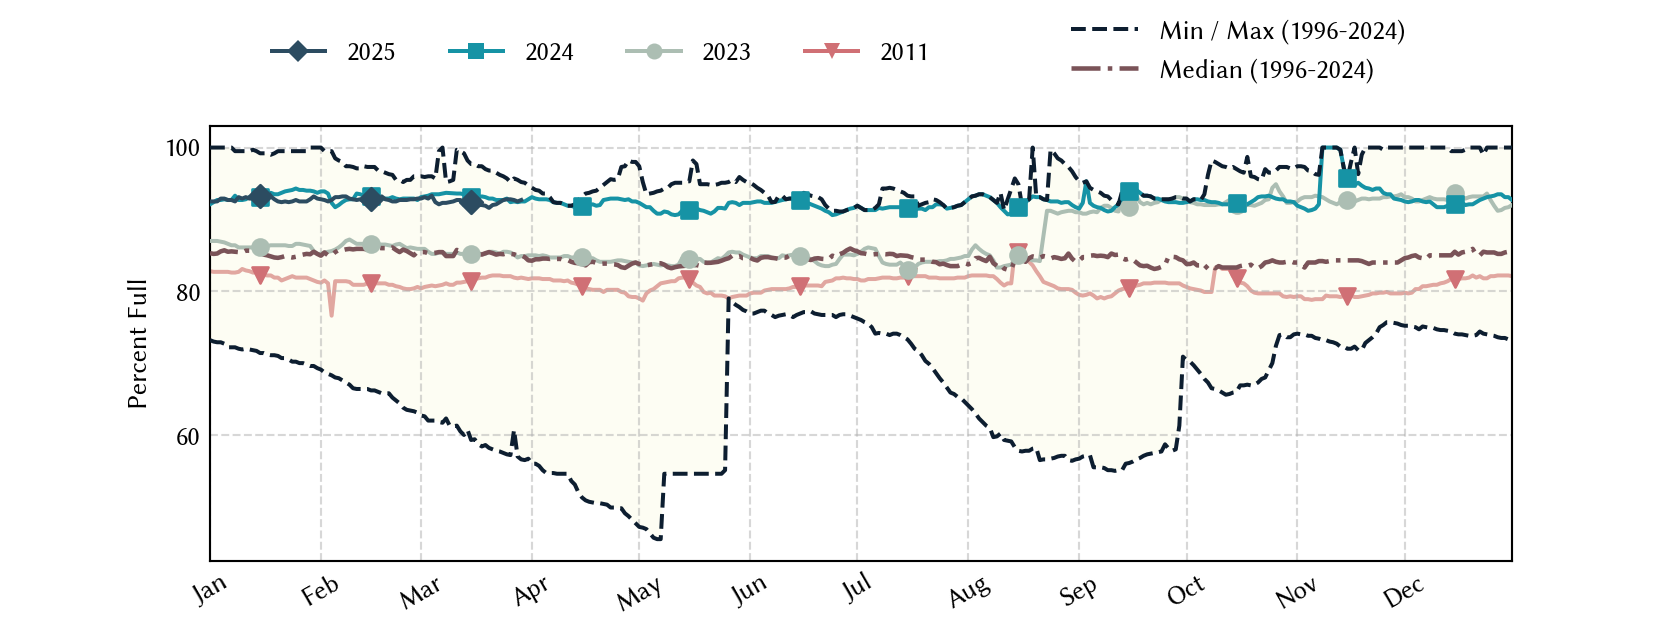
Historical Data
| Date | Percent Full |
Mean Water Level (ft) |
Reservoir Storage (acre-ft) |
Conservation Storage (acre-ft) |
Conservation Capacity (acre-ft) |
Surface Area (acres) |
|
|---|---|---|---|---|---|---|---|
| Today | 2026-07-31 | 85.8 | 1,871.74 | 8,738 | 8,245 | 9,615 | 1,235 |
| Yesterday | 2026-07-30 | 85.6 | 1,871.73 | 8,726 | 8,233 | 9,615 | 1,234 |
| 2 days ago | 2026-07-29 | 85.5 | 1,871.72 | 8,713 | 8,220 | 9,615 | 1,234 |
| 1 week ago | 2026-07-24 | 85.8 | 1,871.74 | 8,738 | 8,245 | 9,615 | 1,235 |
| 1 month ago | 2026-06-30 | 85.4 | 1,871.71 | 8,701 | 8,208 | 9,615 | 1,233 |
| 3 months ago | 2026-04-30 | 86.0 | 1,871.76 | 8,762 | 8,269 | 9,615 | 1,236 |
| 6 months ago | 2026-01-31 | 86.1 | 1,871.77 | 8,775 | 8,282 | 9,615 | 1,237 |
| 1 year ago | 2025-07-31 | 85.1 | 1,871.69 | 8,676 | 8,183 | 9,615 | 1,232 |
*
Percent Full is based on Conservation Storage and Conservation Capacity and doesn't account for storage in flood pool.
**
Values above, including today's are averaged conditions. For near real-time instantaneous water level, see table below or the interactive map viewer.
Most Recent Instantaneous Water Level
| Date/time |
Water Level (ft) |
Conservation Pool Elevation (ft) |
Height Above Conservation Pool (ft) |
|
|---|---|---|---|---|
| Most recent | 2026-07-31 19:30 | 1,871.74 | 1,872.71 | -0.97 |
| 1 hour prior | 2026-07-31 18:30 | 1,871.74 | 1,872.71 | -0.97 |
| 2 hours prior | 2026-07-31 17:30 | 1,871.74 | 1,872.71 | -0.97 |
| 6 hours prior | 2026-07-31 13:30 | 1,871.74 | 1,872.71 | -0.97 |
| 12 hours prior | 2026-07-31 07:30 | 1,871.74 | 1,872.71 | -0.97 |
| 24 hours prior | 2026-07-30 19:30 | 1,871.74 | 1,872.71 | -0.97 |
| 48 hours prior | 2026-07-29 19:30 | 1,871.73 | 1,872.71 | -0.98 |
*
Data is provisional and subject to revision.
Additional Information
| Impoundment date | 1930-01-01 |
|
Vertical datum
|
NAVD88 |
|
Vertical datum
|
NGVD29 |
|
Dead pool elevation |
1,860.51 ft above NAVD88 |
|
Dead pool elevation |
1,860.00 ft above NGVD29 |
|
Service spillway crest elevation |
1,855.81 ft above NAVD88 |
|
Service spillway crest elevation |
1,855.30 ft above NGVD29 |
|
Emergency spillway crest elevation |
1,879.61 ft above NAVD88 |
|
Emergency spillway crest elevation |
1,879.10 ft above NGVD29 |
|
Top of dam elevation |
1,884.01 ft above NAVD88 |
|
Top of dam elevation |
1,883.50 ft above NGVD29 |
|
Conservation pool elevation |
1,872.71 ft above NAVD88 |
|
Conservation pool elevation |
1,872.20 ft above NGVD29 |
| Data download (CSV) | period of record, last one year, last 30 days |
| Data Source | USGS:08132000 |
| USGS Monitoring Location | USGS:08132000 |
Lake Location