Lake Nocona (Farmer's Creek): 79.8% full as of 2026-07-30
Historical Data
| Date | Percent Full |
Mean Water Level (ft) |
Reservoir Storage (acre-ft) |
Conservation Storage (acre-ft) |
Conservation Capacity (acre-ft) |
Surface Area (acres) |
|
|---|---|---|---|---|---|---|---|
| Today | 2026-07-30 | 79.8 | 824.12 | 17,424 | 17,120 | 21,444 | 1,215 |
| Yesterday | 2026-07-29 | 79.9 | 824.14 | 17,448 | 17,144 | 21,444 | 1,216 |
| 2 days ago | 2026-07-28 | 80.1 | 824.17 | 17,485 | 17,181 | 21,444 | 1,217 |
| 1 week ago | 2026-07-23 | 81.0 | 824.32 | 17,668 | 17,364 | 21,444 | 1,224 |
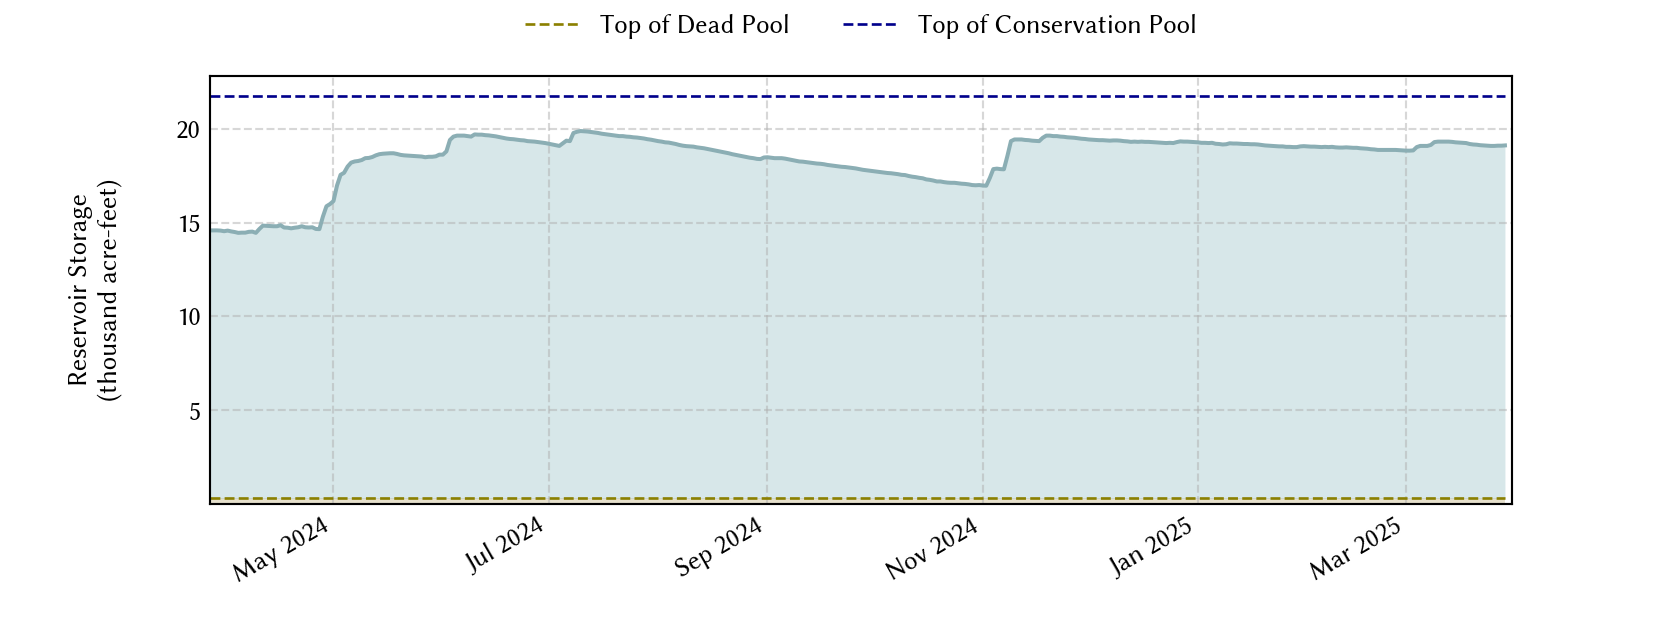
| 1 month ago | 2026-06-30 | 83.9 | 824.83 | 18,297 | 17,993 | 21,444 | 1,244 |
| 3 months ago | 2026-04-30 | 86.3 | 825.24 | 18,811 | 18,507 | 21,444 | 1,259 |
| 6 months ago | 2026-01-30 | 86.2 | 825.22 | 18,785 | 18,481 | 21,444 | 1,258 |
| 1 year ago | 2025-07-30 | 97.8 | 827.15 | 21,282 | 20,978 | 21,444 | 1,328 |
*
Percent Full is based on Conservation Storage and Conservation Capacity and doesn't account for storage in flood pool.
**
Values above, including today's are averaged conditions. For near real-time instantaneous water level, see table below or the interactive map viewer.
Most Recent Instantaneous Water Level
| Date/time |
Water Level (ft) |
Conservation Pool Elevation (ft) |
Height Above Conservation Pool (ft) |
|
|---|---|---|---|---|
| Most recent | 2026-07-30 15:00 | 824.11 | 827.50 | -3.39 |
| 1 hour prior | 2026-07-30 14:00 | 824.11 | 827.50 | -3.39 |
| 2 hours prior | 2026-07-30 13:00 | 824.11 | 827.50 | -3.39 |
| 6 hours prior | 2026-07-30 09:00 | 824.12 | 827.50 | -3.38 |
| 12 hours prior | 2026-07-30 03:00 | 824.12 | 827.50 | -3.38 |
| 24 hours prior | 2026-07-29 15:00 | 824.14 | 827.50 | -3.36 |
| 48 hours prior | 2026-07-28 15:00 | 824.16 | 827.50 | -3.34 |
*
Data is provisional and subject to revision.
Additional Information
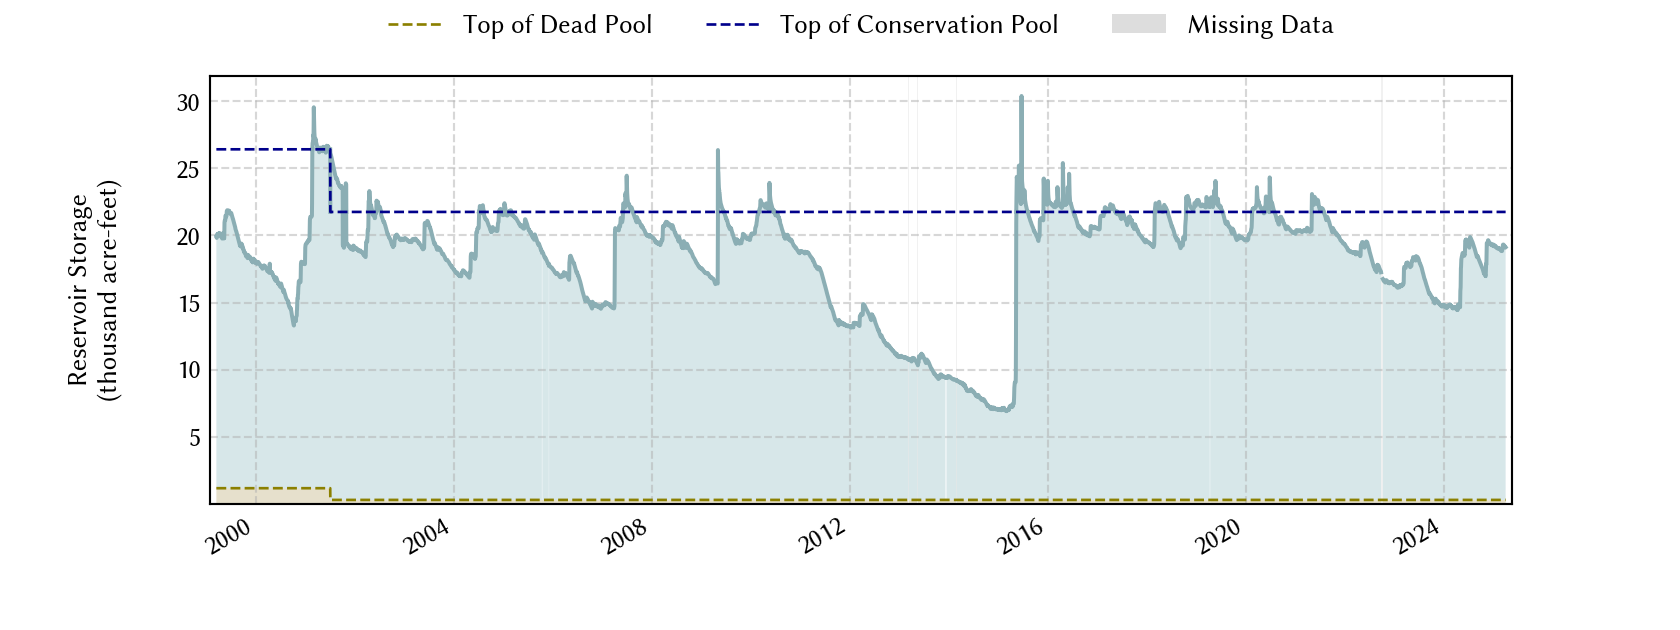
| Impoundment date | 1960-01-01 |
| Vertical datum | NGVD29 |
|
Dead pool elevation |
795.00 ft above NGVD29 |
|
Dead pool elevation |
795.00 ft above NGVD29 |
| Service spillway crest elevation | 827.50 ft above NGVD29 |
| Emergency spillway crest elevation | 835.00 ft above NGVD29 |
| Top of dam elevation | 847.00 ft above NGVD29 |
|
Conservation pool elevation |
827.50 ft above NGVD29 |
|
Conservation pool elevation |
827.00 ft above NGVD29 |
| Data download (CSV) | period of record, last one year, last 30 days |
| Data Source | USGS:07315600 |
| USGS Monitoring Location | USGS:07315600 |
Lake Location
