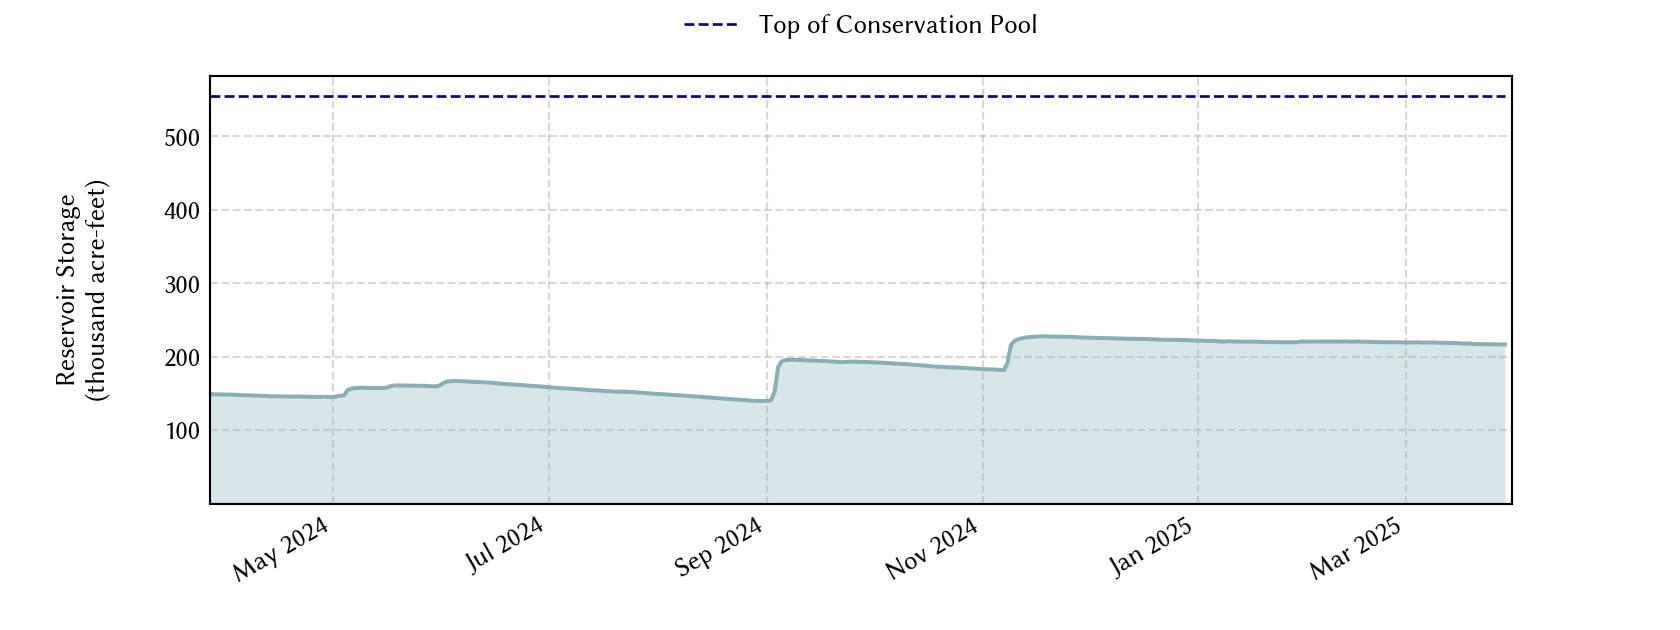
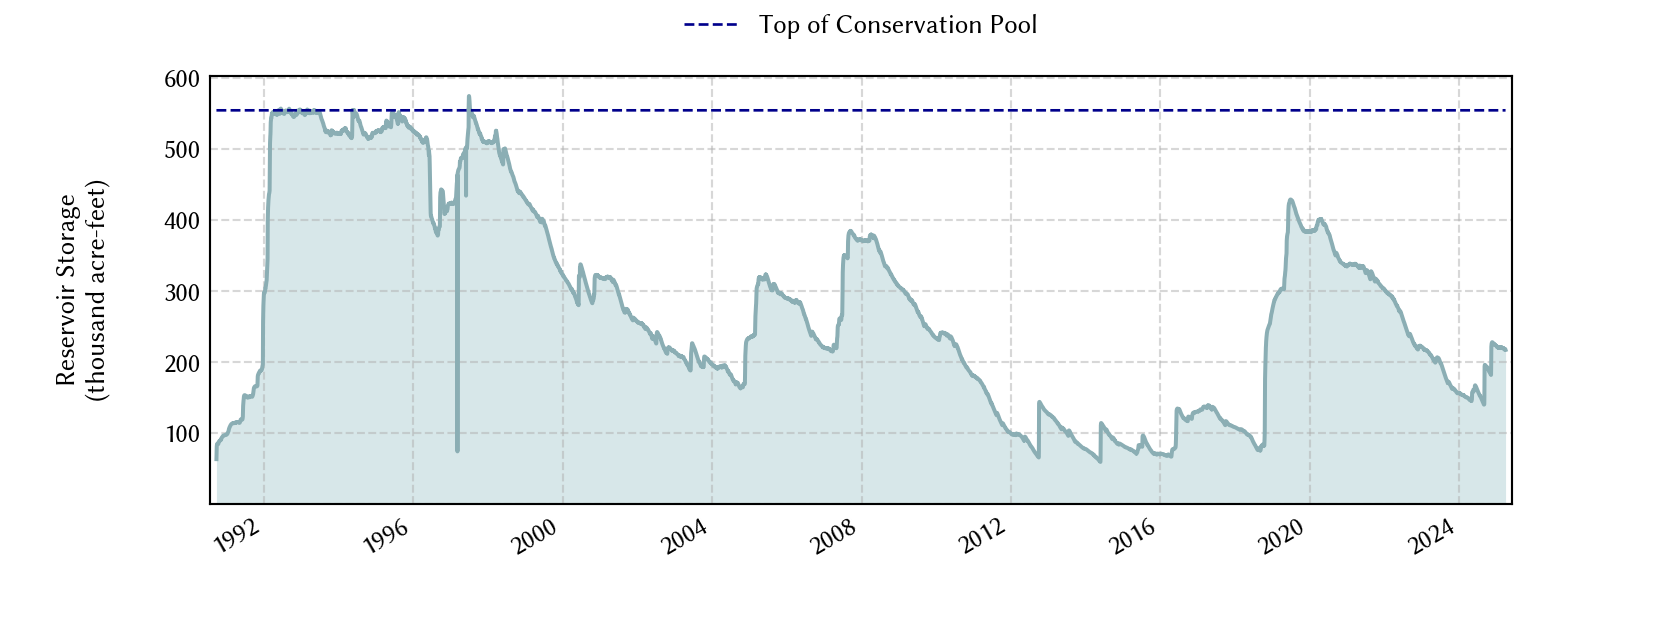
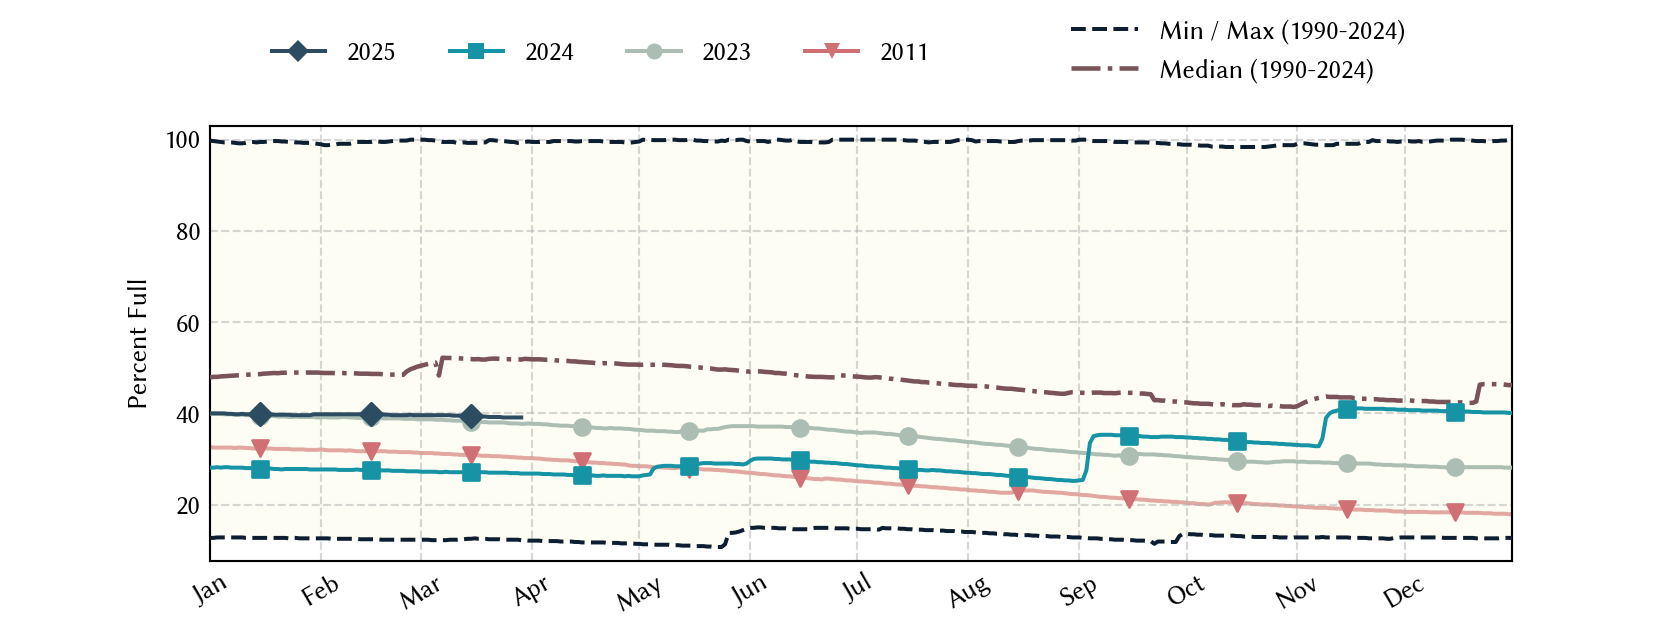
O. H. Ivie Reservoir: 46.2% full as of 2026-07-31
Historical Data
| Date | Percent Full |
Mean Water Level (ft) |
Reservoir Storage (acre-ft) |
Conservation Storage (acre-ft) |
Conservation Capacity (acre-ft) |
Surface Area (acres) |
|
|---|---|---|---|---|---|---|---|
| Today | 2026-07-31 | 46.2 | 1,531.74 | 255,881 | 255,881 | 554,340 | - n.a. - |
| Yesterday | 2026-07-30 | 46.2 | 1,531.77 | 256,216 | 256,216 | 554,340 | - n.a. - |
| 2 days ago | 2026-07-29 | 46.3 | 1,531.81 | 256,664 | 256,664 | 554,340 | - n.a. - |
| 1 week ago | 2026-07-24 | 46.7 | 1,532.01 | 258,903 | 258,903 | 554,340 | - n.a. - |
| 1 month ago | 2026-06-30 | 47.6 | 1,532.46 | 264,095 | 264,095 | 554,340 | - n.a. - |
| 3 months ago | 2026-04-30 | 47.0 | 1,532.13 | 260,288 | 260,288 | 554,340 | - n.a. - |
| 6 months ago | 2026-01-31 | 46.4 | 1,531.84 | 256,999 | 256,999 | 554,340 | - n.a. - |
| 1 year ago | 2025-07-31 | 53.8 | 1,535.31 | 298,451 | 298,451 | 554,340 | - n.a. - |
*
Percent Full is based on Conservation Storage and Conservation Capacity and doesn't account for storage in flood pool.
**
Values above, including today's are averaged conditions. For near real-time instantaneous water level, see table below or the interactive map viewer.
Most Recent Instantaneous Water Level
| Date/time |
Water Level (ft) |
Conservation Pool Elevation (ft) |
Height Above Conservation Pool (ft) |
|
|---|---|---|---|---|
| Most recent | 2026-07-31 19:45 | 1,531.71 | 1,551.50 | -19.79 |
| 1 hour prior | 2026-07-31 18:45 | 1,531.72 | 1,551.50 | -19.78 |
| 2 hours prior | 2026-07-31 17:45 | 1,531.72 | 1,551.50 | -19.78 |
| 6 hours prior | 2026-07-31 13:45 | 1,531.73 | 1,551.50 | -19.77 |
| 12 hours prior | 2026-07-31 07:45 | 1,531.74 | 1,551.50 | -19.76 |
| 24 hours prior | 2026-07-30 19:45 | 1,531.75 | 1,551.50 | -19.75 |
| 48 hours prior | 2026-07-29 19:45 | 1,531.79 | 1,551.50 | -19.71 |
*
Data is provisional and subject to revision.
Additional Information
| Impoundment date | 1989-01-01 |
| Vertical datum | NGVD29 |
| Dead pool elevation | 1,480.00 ft above NGVD29 |
| Service spillway crest elevation | 1,551.50 ft above NGVD29 |
| Emergency spillway crest elevation | 1,562.00 ft above NGVD29 |
| Top of dam elevation | 1,584.00 ft above NGVD29 |
| Conservation pool elevation | 1,551.50 ft above NGVD29 |
| Data download (CSV) | period of record, last one year, last 30 days |
Elevation-Area-Capacity Curves
2004-09-30 (source: CRMWD)
|
|
| Data Source | USGS:08136600 |
| USGS Monitoring Location | USGS:08136600 |
Lake Location