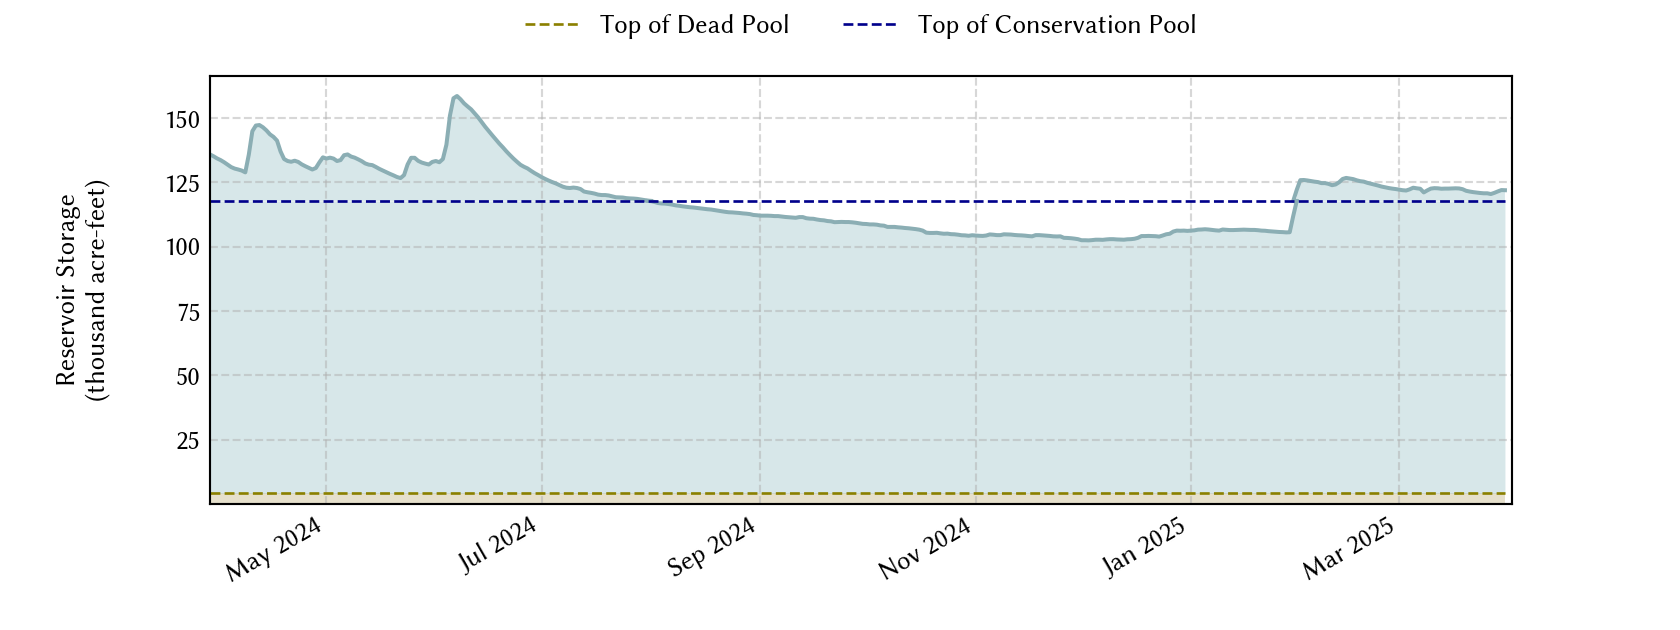
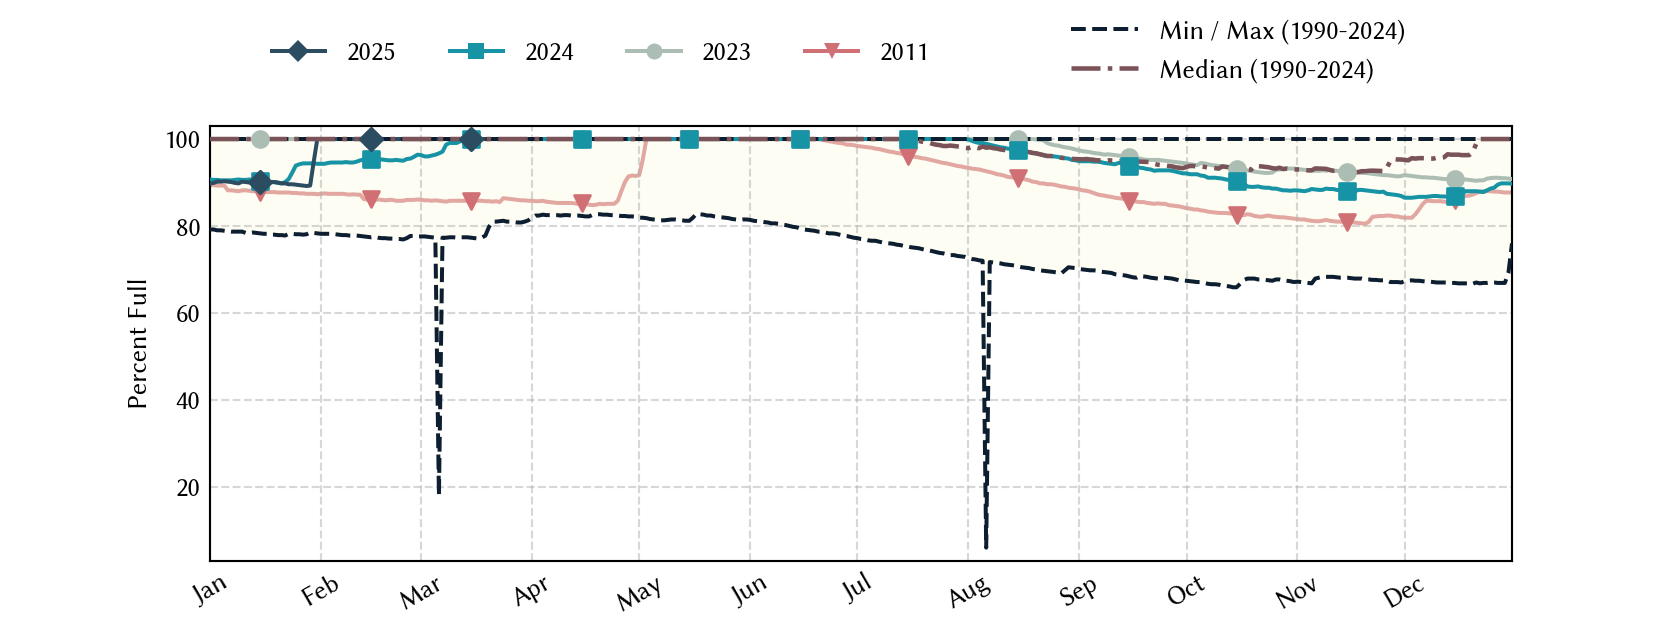
Pat Mayse Lake: 100.0% full as of 2026-07-28
Historical Data
| Date | Percent Full |
Mean Water Level (ft) |
Reservoir Storage (acre-ft) |
Conservation Storage (acre-ft) |
Conservation Capacity (acre-ft) |
Surface Area (acres) |
|
|---|---|---|---|---|---|---|---|
| Today | 2026-07-28 | 100.0 | 451.30 | 119,540 | 113,683 | 113,683 | - n.a. - |
| Yesterday | 2026-07-27 | 100.0 | 451.34 | 119,767 | 113,683 | 113,683 | - n.a. - |
| 2 days ago | 2026-07-26 | 100.0 | 451.39 | 120,051 | 113,683 | 113,683 | - n.a. - |
| 1 week ago | 2026-07-21 | 100.0 | 451.70 | 121,817 | 113,683 | 113,683 | - n.a. - |
| 1 month ago | 2026-06-28 | 100.0 | 454.54 | 138,479 | 113,683 | 113,683 | - n.a. - |
| 3 months ago | 2026-04-28 | 91.6 | 449.27 | 108,261 | 104,101 | 113,683 | 5,374 |
| 6 months ago | 2026-01-28 | 87.6 | 448.43 | 103,798 | 99,638 | 113,683 | 5,258 |
| 1 year ago | 2025-07-28 | 100.0 | 451.31 | 119,597 | 113,683 | 113,683 | - n.a. - |
*
Percent Full is based on Conservation Storage and Conservation Capacity and doesn't account for storage in flood pool.
**
Values above, including today's are averaged conditions. For near real-time instantaneous water level, see table below or the interactive map viewer.
Most Recent Instantaneous Water Level
| Date/time |
Water Level (ft) |
Conservation Pool Elevation (ft) |
Height Above Conservation Pool (ft) |
|
|---|---|---|---|---|
| Most recent | 2026-07-28 15:00 | 451.28 | 451.00 | 0.28 |
| 1 hour prior | 2026-07-28 14:00 | 451.28 | 451.00 | 0.28 |
| 2 hours prior | 2026-07-28 13:00 | 451.28 | 451.00 | 0.28 |
| 6 hours prior | 2026-07-28 09:00 | 451.30 | 451.00 | 0.30 |
| 12 hours prior | 2026-07-28 03:00 | 451.31 | 451.00 | 0.31 |
| 24 hours prior | 2026-07-27 15:00 | 451.34 | 451.00 | 0.34 |
| 48 hours prior | 2026-07-26 15:00 | 451.38 | 451.00 | 0.38 |
*
Data is provisional and subject to revision.
Additional Information
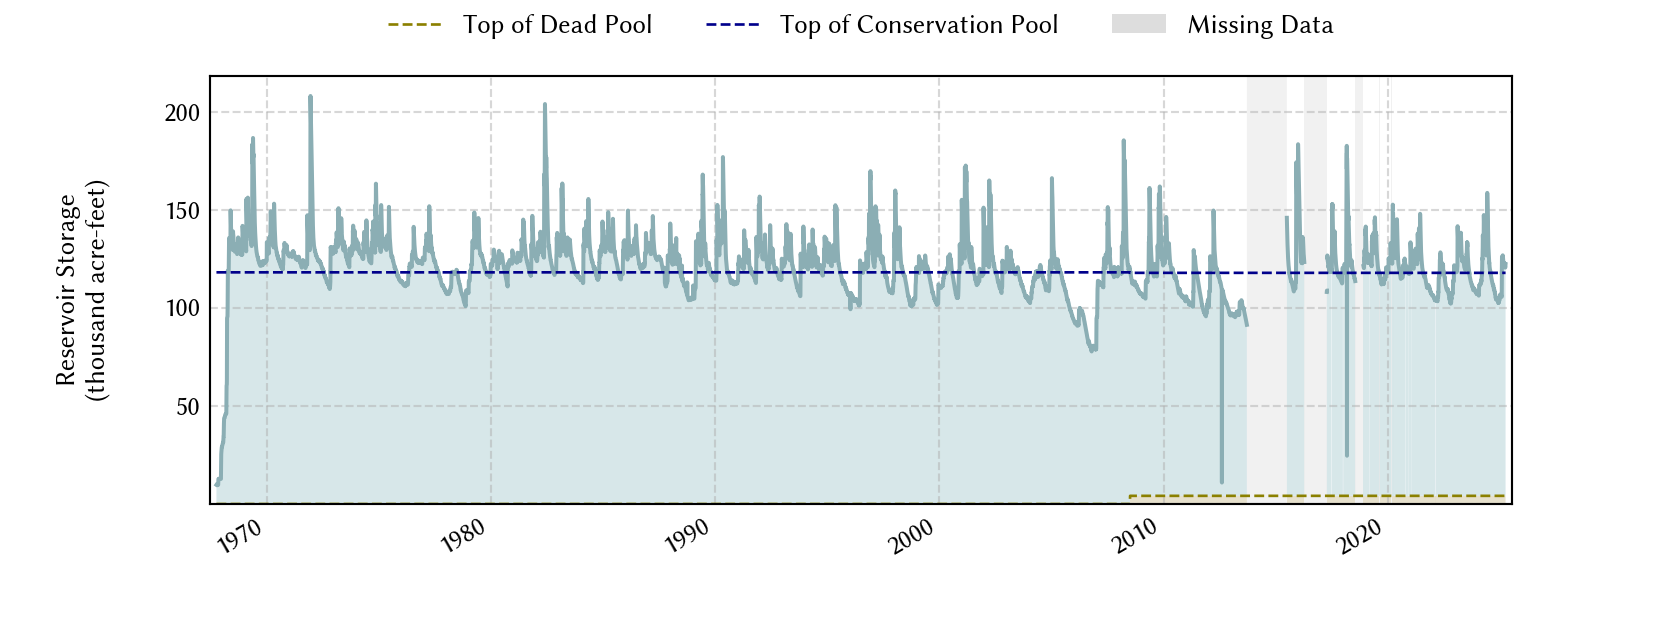
| Impoundment date | 1967-01-01 |
| Vertical datum | NGVD29 |
| Dead pool elevation | 415.00 ft above NGVD29 |
| Service spillway crest elevation | 451.00 ft above NGVD29 |
| Emergency spillway crest elevation | 477.00 ft above NGVD29 |
| Flood pool elevation | 460.50 ft above NGVD29 |
| Top of dam elevation | 488.50 ft above NGVD29 |
| Conservation pool elevation | 451.00 ft above NGVD29 |
| Data download (CSV) | period of record, last one year, last 30 days |
| Data Source | USACE:MYST2 |
Lake Location
