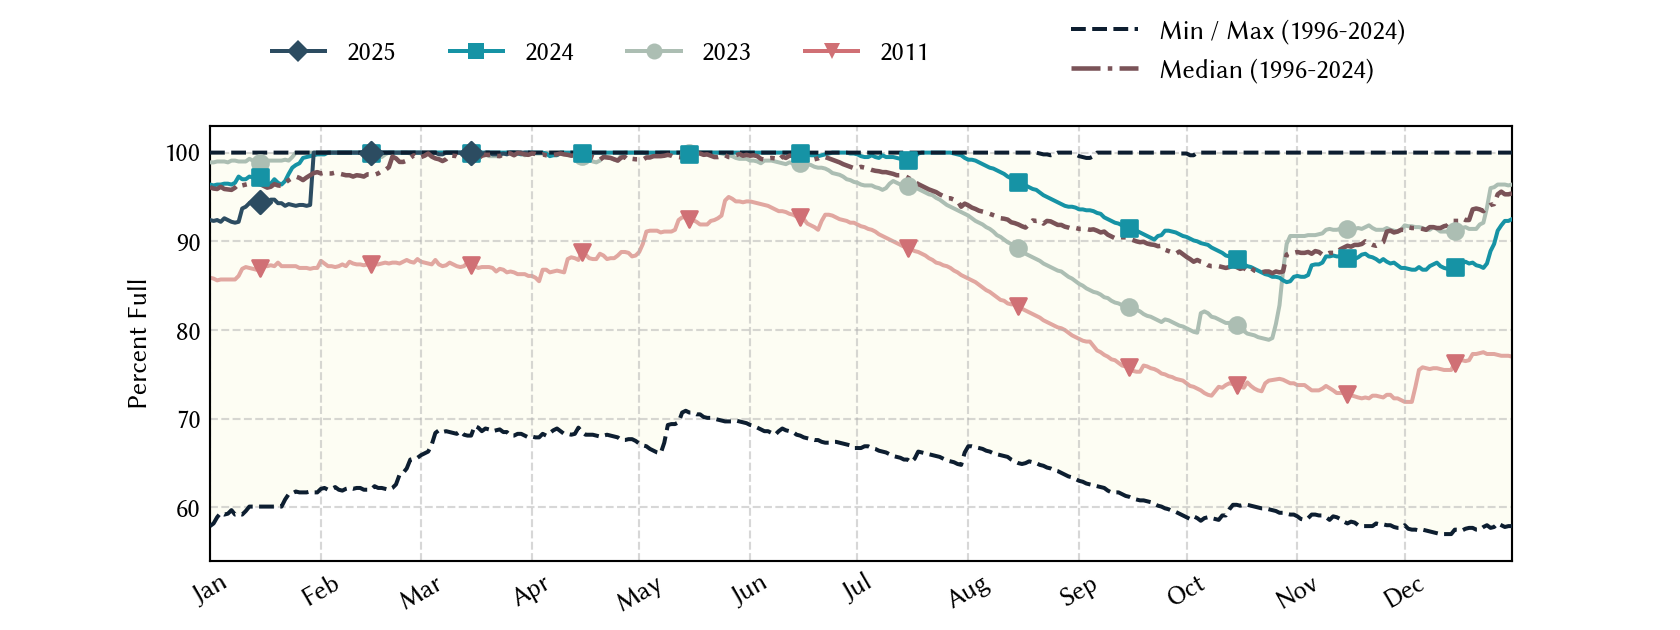
Lake Ray Hubbard: 96.4% full as of 2026-07-30
Historical Data
| Date | Percent Full |
Mean Water Level (ft) |
Reservoir Storage (acre-ft) |
Conservation Storage (acre-ft) |
Conservation Capacity (acre-ft) |
Surface Area (acres) |
|
|---|---|---|---|---|---|---|---|
| Today | 2026-07-30 | 96.4 | 434.74 | 423,933 | 423,933 | 439,559 | 20,296 |
| Yesterday | 2026-07-29 | 96.5 | 434.76 | 424,339 | 424,339 | 439,559 | 20,306 |
| 2 days ago | 2026-07-28 | 96.7 | 434.80 | 425,151 | 425,151 | 439,559 | 20,325 |
| 1 week ago | 2026-07-23 | 97.9 | 435.05 | 430,250 | 430,250 | 439,559 | 20,474 |
| 1 month ago | 2026-06-30 | 99.9 | 435.47 | 438,932 | 438,932 | 439,559 | 20,910 |
| 3 months ago | 2026-04-30 | 100.0 | 435.58 | 441,240 | 439,559 | 439,559 | 21,048 |
| 6 months ago | 2026-01-30 | 92.5 | 433.87 | 406,427 | 406,427 | 439,559 | 19,965 |
| 1 year ago | 2025-07-30 | 97.6 | 435.00 | 429,227 | 429,227 | 439,559 | 20,438 |
*
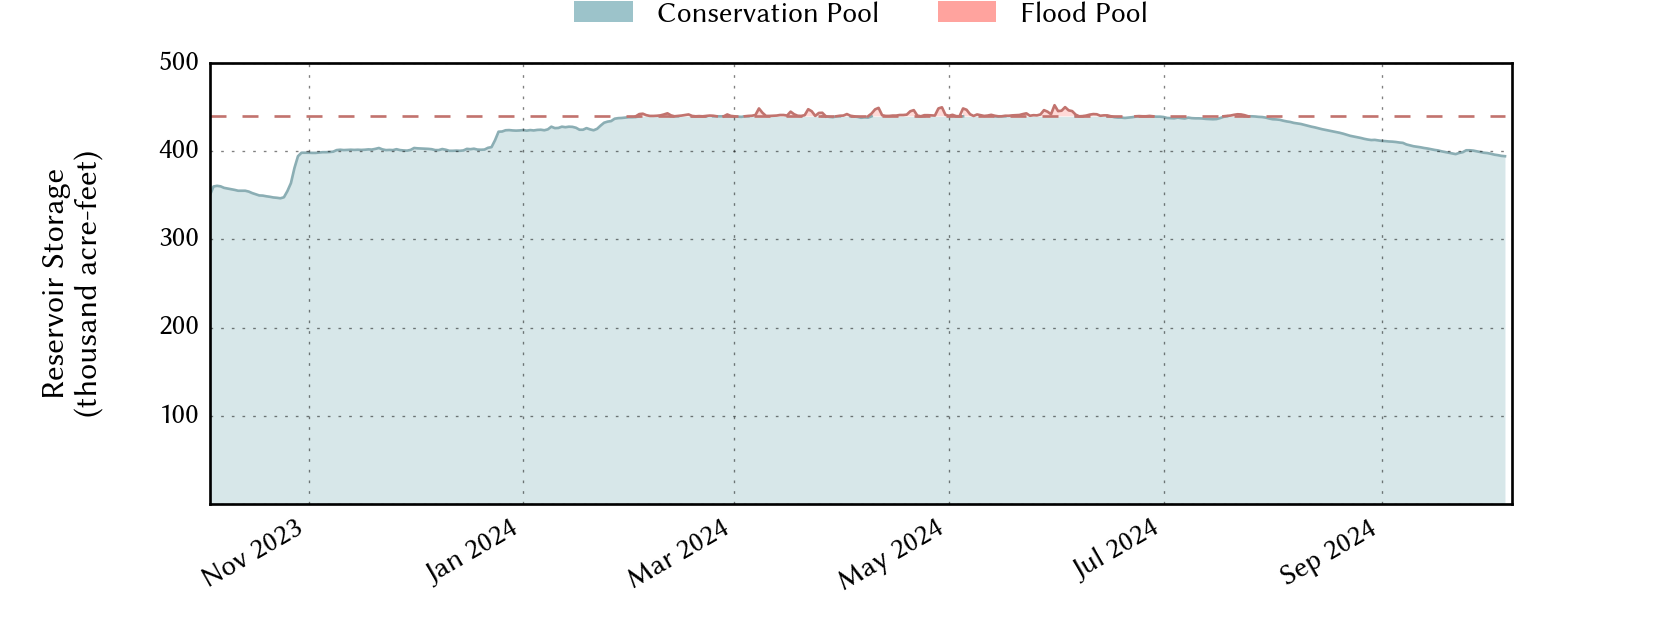
Percent Full is based on Conservation Storage and Conservation Capacity and doesn't account for storage in flood pool.
**
Values above, including today's are averaged conditions. For near real-time instantaneous water level, see table below or the interactive map viewer.
Most Recent Instantaneous Water Level
| Date/time |
Water Level (ft) |
Conservation Pool Elevation (ft) |
Height Above Conservation Pool (ft) |
|
|---|---|---|---|---|
| Most recent | 2026-07-30 06:15 | 434.72 | 435.50 | -0.78 |
| 1 hour prior | 2026-07-30 05:15 | 434.73 | 435.50 | -0.77 |
| 2 hours prior | 2026-07-30 04:15 | 434.73 | 435.50 | -0.77 |
| 6 hours prior | 2026-07-30 00:15 | 434.75 | 435.50 | -0.75 |
| 12 hours prior | 2026-07-29 18:15 | 434.74 | 435.50 | -0.76 |
| 24 hours prior | 2026-07-29 06:15 | 434.76 | 435.50 | -0.74 |
| 48 hours prior | 2026-07-28 06:15 | 434.80 | 435.50 | -0.70 |
*
Data is provisional and subject to revision.
Additional Information
| Impoundment date | 1969-01-01 |
| Vertical datum | NGVD29 |
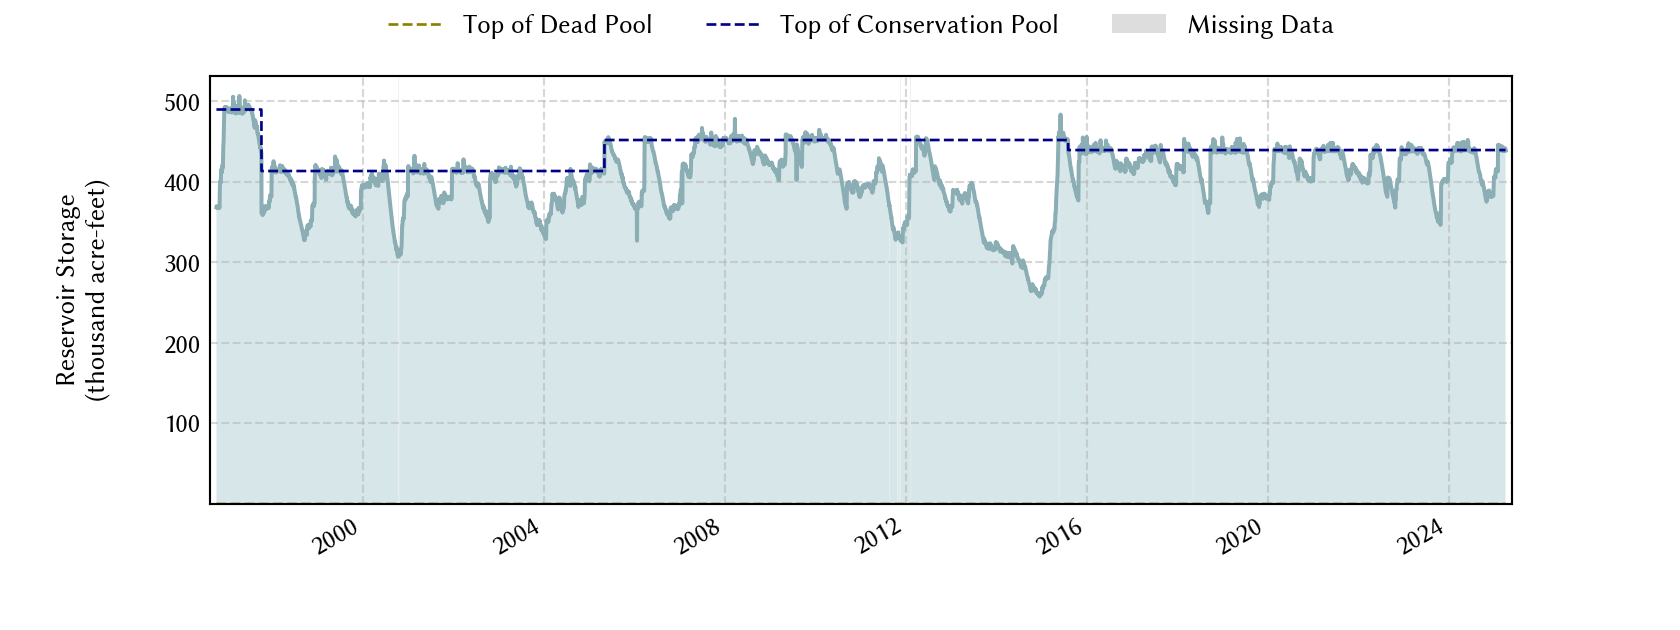
| Dead pool elevation | 388.00 ft above NGVD29 |
| Service spillway crest elevation | 409.50 ft above NGVD29 |
| Emergency spillway crest elevation | 437.50 ft above NGVD29 |
| Top of dam elevation | 450.00 ft above NGVD29 |
| Conservation pool elevation | 435.50 ft above NGVD29 |
| Data download (CSV) | period of record, last one year, last 30 days |
Elevation-Area-Capacity Curves
1969-01-01 (source: USGS)
1997-10-01 (source: USGS)
2005-05-01 (source: TWDB)
: GIS Data
2015-08-01 (source: TWDB)
: GIS Data
|
|
| Data Source | USGS:08061550 |
| USGS Monitoring Location | USGS:08061550 |
Lake Location