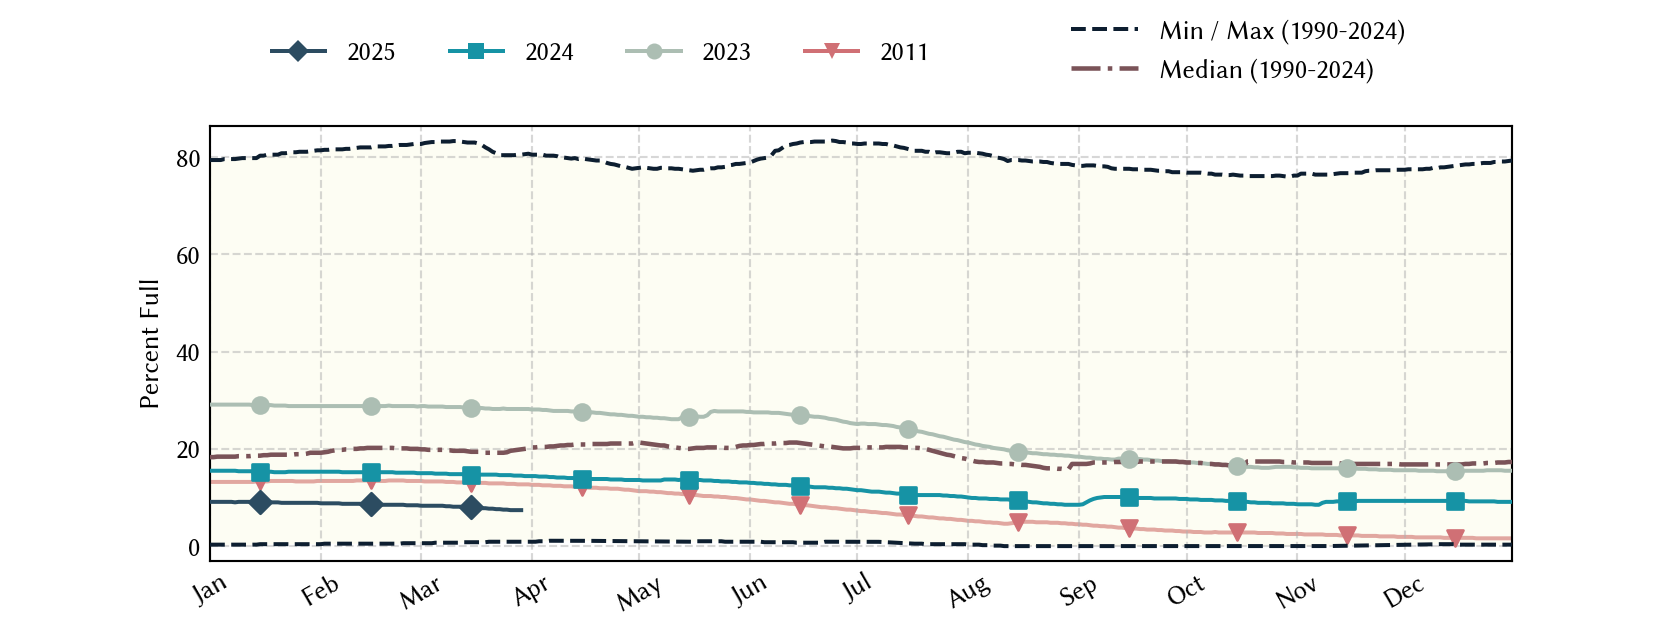
Twin Buttes Reservoir: 7.7% full as of 2026-07-31
Historical Data
| Date | Percent Full |
Mean Water Level (ft) |
Reservoir Storage (acre-ft) |
Conservation Storage (acre-ft) |
Conservation Capacity (acre-ft) |
Surface Area (acres) |
|
|---|---|---|---|---|---|---|---|
| Today | 2026-07-31 | 7.7 | 1,899.55 | 17,739 | 13,990 | 182,454 | 1,328 |
| Yesterday | 2026-07-30 | 7.7 | 1,899.60 | 17,805 | 14,056 | 182,454 | 1,331 |
| 2 days ago | 2026-07-29 | 7.8 | 1,899.67 | 17,898 | 14,149 | 182,454 | 1,335 |
| 1 week ago | 2026-07-24 | 8.0 | 1,900.01 | 18,348 | 14,599 | 182,454 | 1,356 |
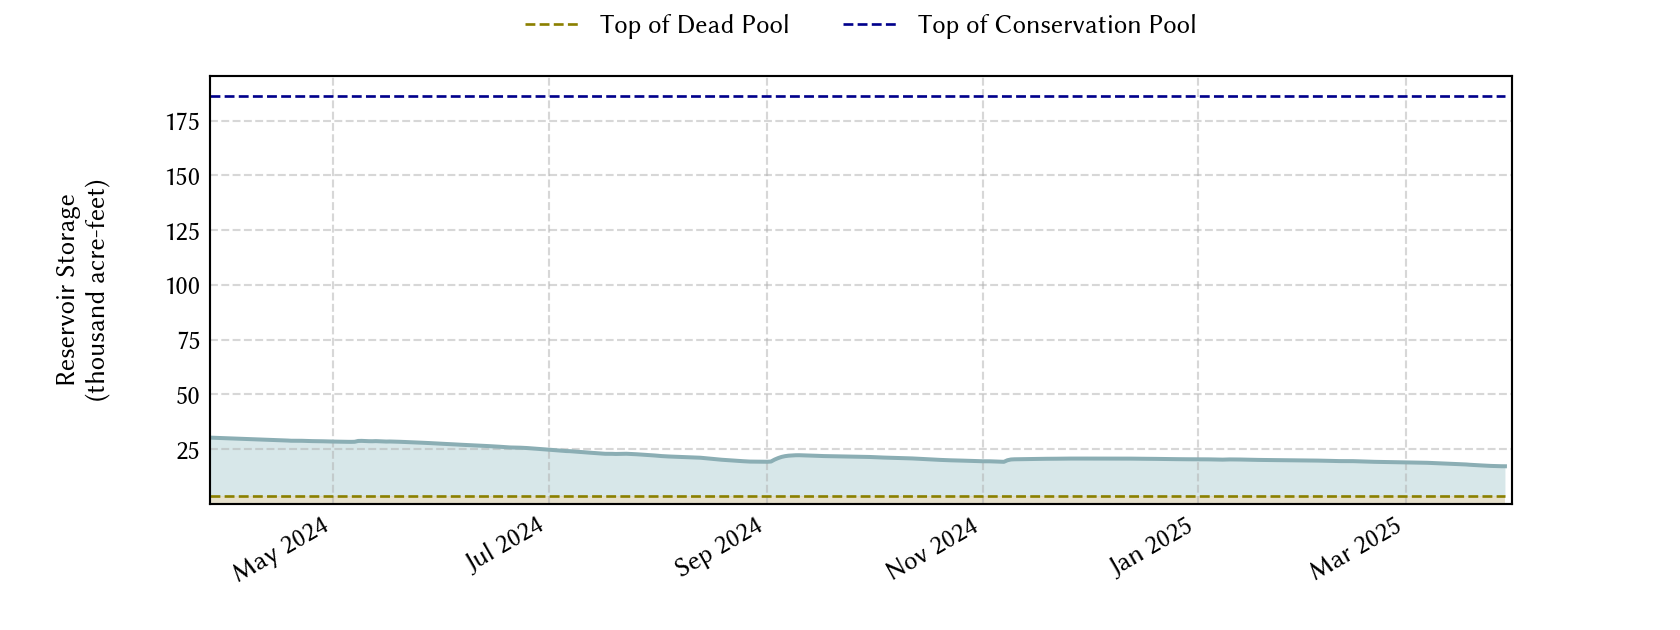
| 1 month ago | 2026-06-30 | 8.6 | 1,900.74 | 19,360 | 15,611 | 182,454 | 1,408 |
| 3 months ago | 2026-04-30 | 10.3 | 1,902.89 | 22,526 | 18,777 | 182,454 | 1,563 |
| 6 months ago | 2026-01-31 | 11.7 | 1,904.45 | 25,040 | 21,291 | 182,454 | 1,675 |
| 1 year ago | 2025-07-31 | 15.9 | 1,908.58 | 32,790 | 29,041 | 182,454 | 2,112 |
*
Percent Full is based on Conservation Storage and Conservation Capacity and doesn't account for storage in flood pool.
**
Values above, including today's are averaged conditions. For near real-time instantaneous water level, see table below or the interactive map viewer.
Most Recent Instantaneous Water Level
| Date/time |
Water Level (ft) |
Conservation Pool Elevation (ft) |
Height Above Conservation Pool (ft) |
|
|---|---|---|---|---|
| Most recent | 2026-07-31 15:00 | 1,899.52 | 1,940.20 | -40.68 |
| 1 hour prior | 2026-07-31 14:00 | 1,899.52 | 1,940.20 | -40.68 |
| 2 hours prior | 2026-07-31 13:00 | 1,899.53 | 1,940.20 | -40.67 |
| 6 hours prior | 2026-07-31 09:00 | 1,899.54 | 1,940.20 | -40.66 |
| 12 hours prior | 2026-07-31 03:00 | 1,899.55 | 1,940.20 | -40.65 |
| 24 hours prior | 2026-07-30 15:00 | 1,899.60 | 1,940.20 | -40.60 |
| 48 hours prior | 2026-07-29 15:00 | 1,899.66 | 1,940.20 | -40.54 |
*
Data is provisional and subject to revision.
Additional Information
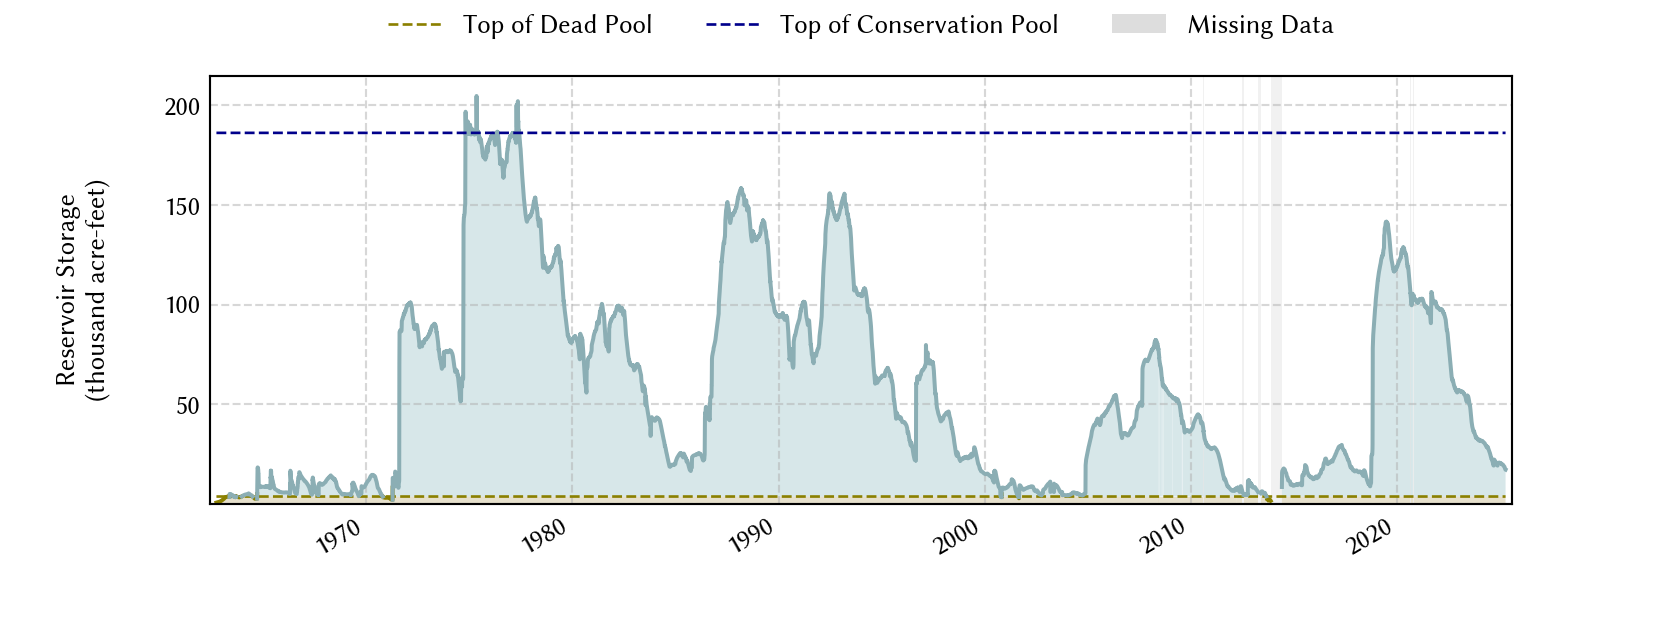
| Impoundment date | 1963-01-01 |
| Vertical datum | NGVD29 |
| Dead pool elevation | 1,885.00 ft above NGVD29 |
| Emergency spillway crest elevation | 1,969.10 ft above NGVD29 |
| Flood pool elevation | 1,969.10 ft above NGVD29 |
| Maximum design elevation | 1,985.00 ft above NGVD29 |
| Top of dam elevation | 1,991.00 ft above NGVD29 |
| Conservation pool elevation | 1,940.20 ft above NGVD29 |
| Data download (CSV) | period of record, last one year, last 30 days |
Elevation-Area-Capacity Curves
1964-01-01 (source: USBR)
|
|
| Data Source | USGS:08131200 |
| USGS Monitoring Location | USGS:08131200 |
Lake Location