Dallas Area Reservoirs: Monitored Water Supply Reservoirs are 100.0% full on 2025-07-16
Historical Data
| Date | Percent Full |
Reservoir Storage (acre-ft) |
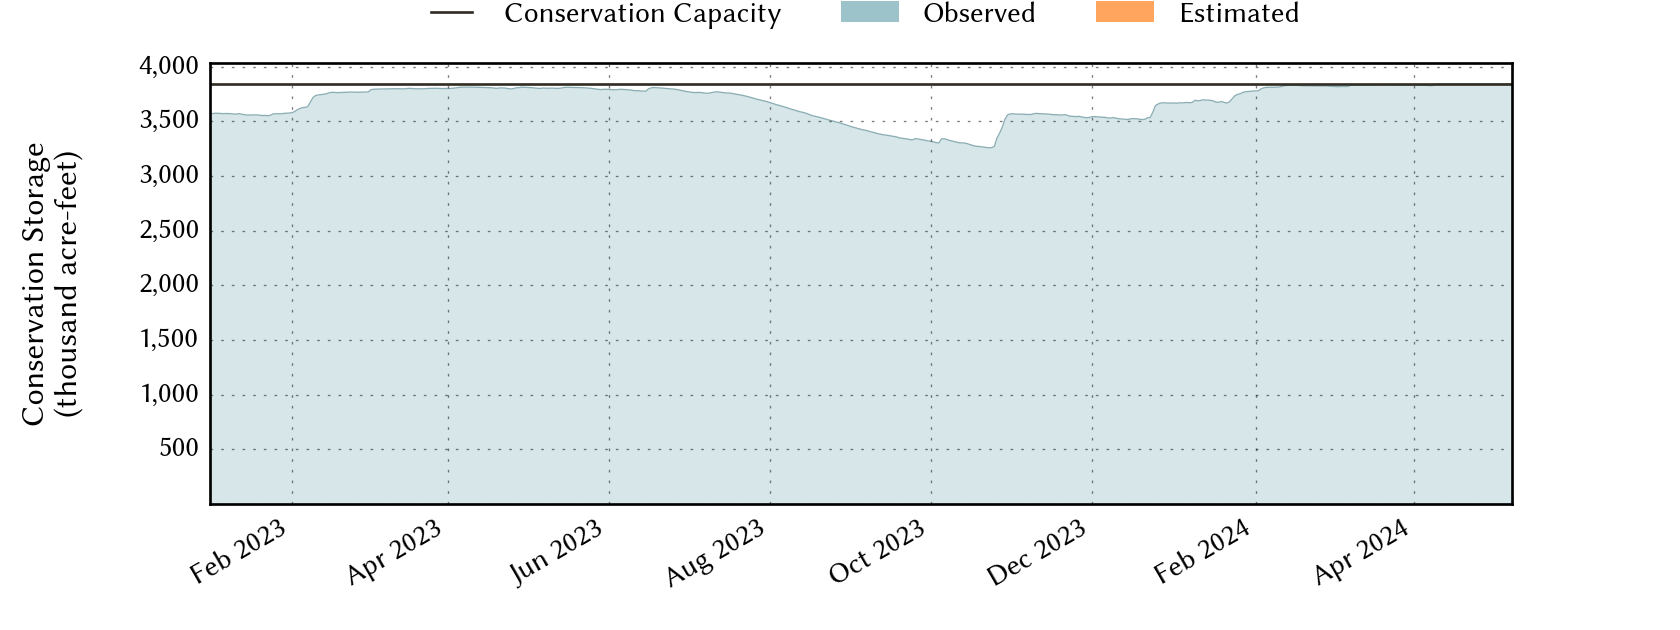
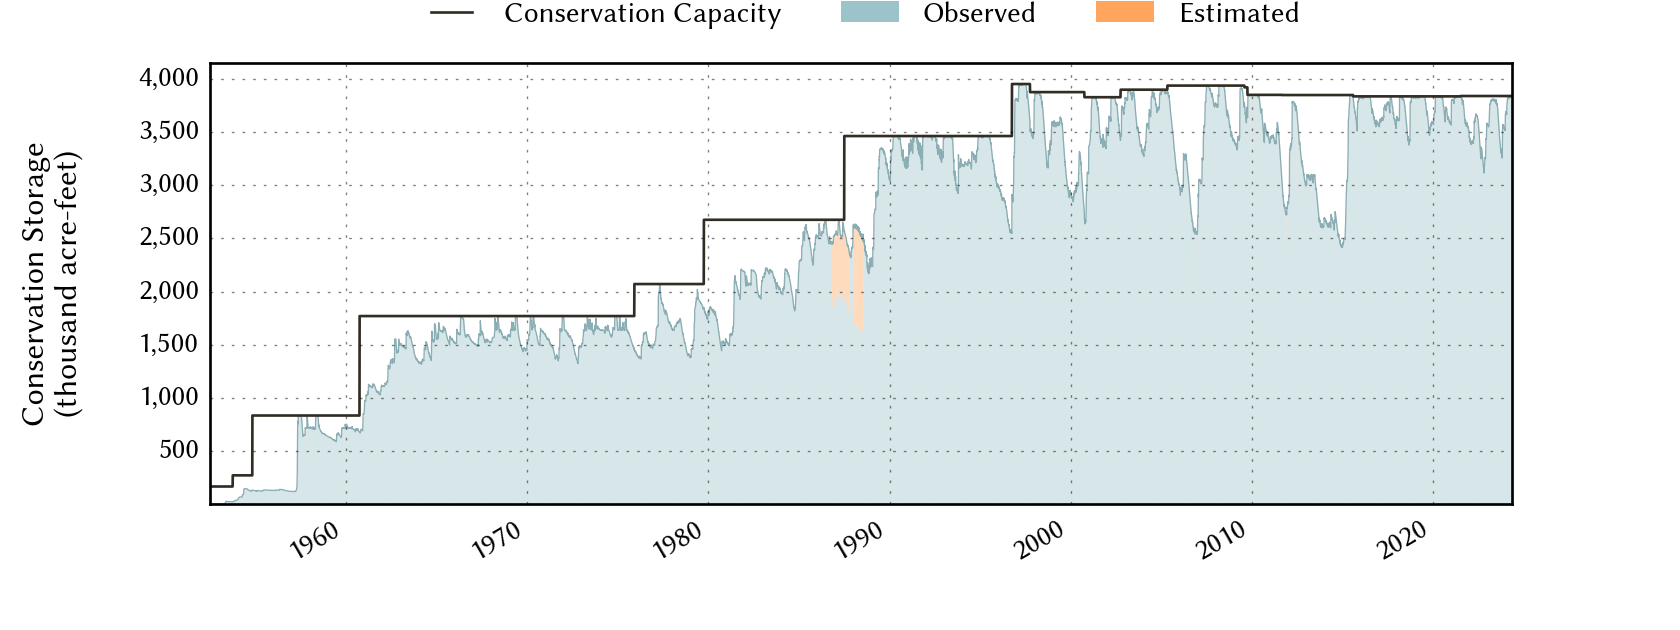
Conservation Storage (acre-ft) |
Conservation Capacity (acre-ft) |
|
|---|---|---|---|---|---|
| Today | 2025-07-16 | 100.0 | 3,952,827 | 3,840,521 | 3,840,521 |
| Yesterday | 2025-07-15 | 100.0 | 3,952,827 | 3,840,521 | 3,840,521 |
| 2 days ago | 2025-07-14 | 100.0 | 3,956,052 | 3,840,521 | 3,840,521 |
| 1 week ago | 2025-07-09 | 100.0 | 3,956,692 | 3,839,268 | 3,840,521 |
| 1 month ago | 2025-06-16 | 100.0 | 4,245,148 | 3,840,521 | 3,840,521 |
| 3 months ago | 2025-04-16 | 98.2 | 3,888,744 | 3,772,923 | 3,840,521 |
| 6 months ago | 2025-01-16 | 93.4 | 3,656,885 | 3,586,596 | 3,840,521 |
| 1 year ago | 2024-07-16 | 99.8 | 4,190,000 | 3,831,106 | 3,840,521 |
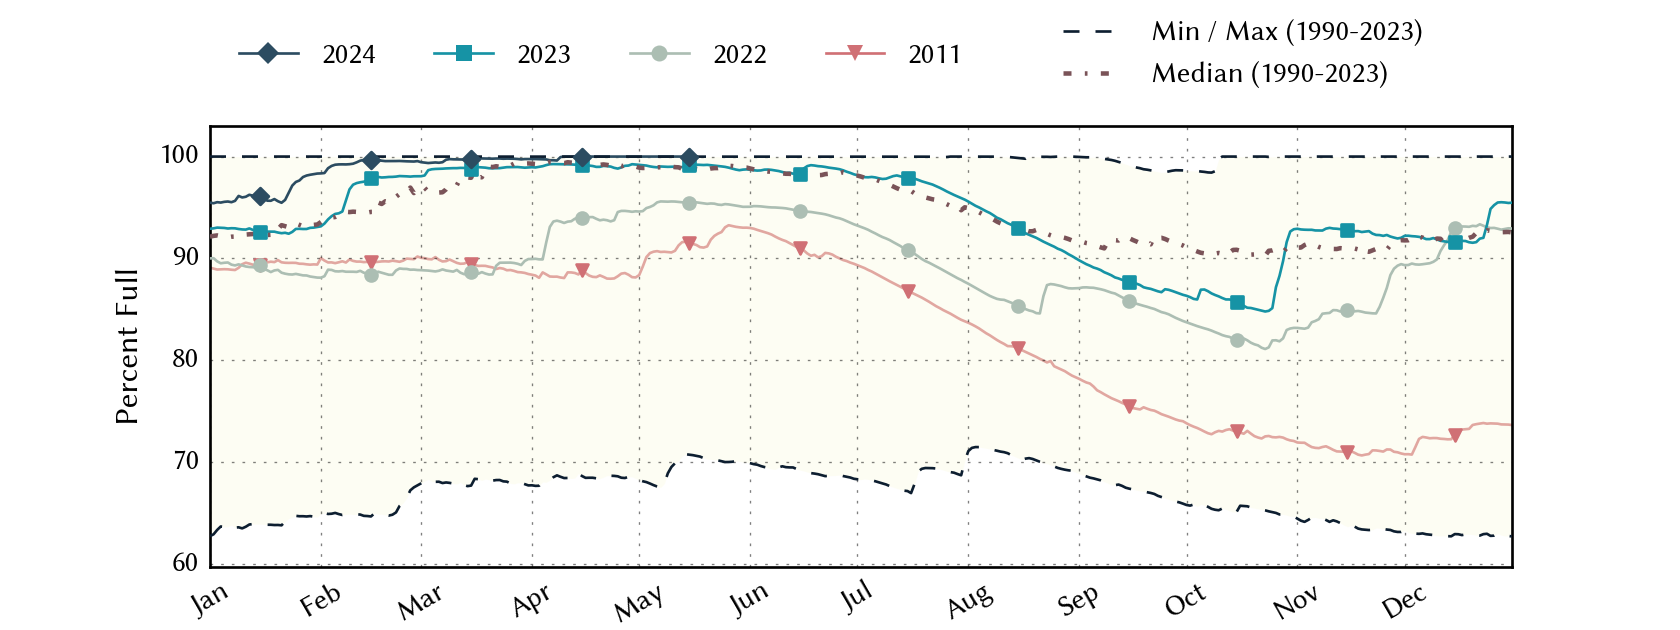
*
Percent Full is based on Conservation Storage and Conservation Capacity and doesn't account for storage in flood pool.
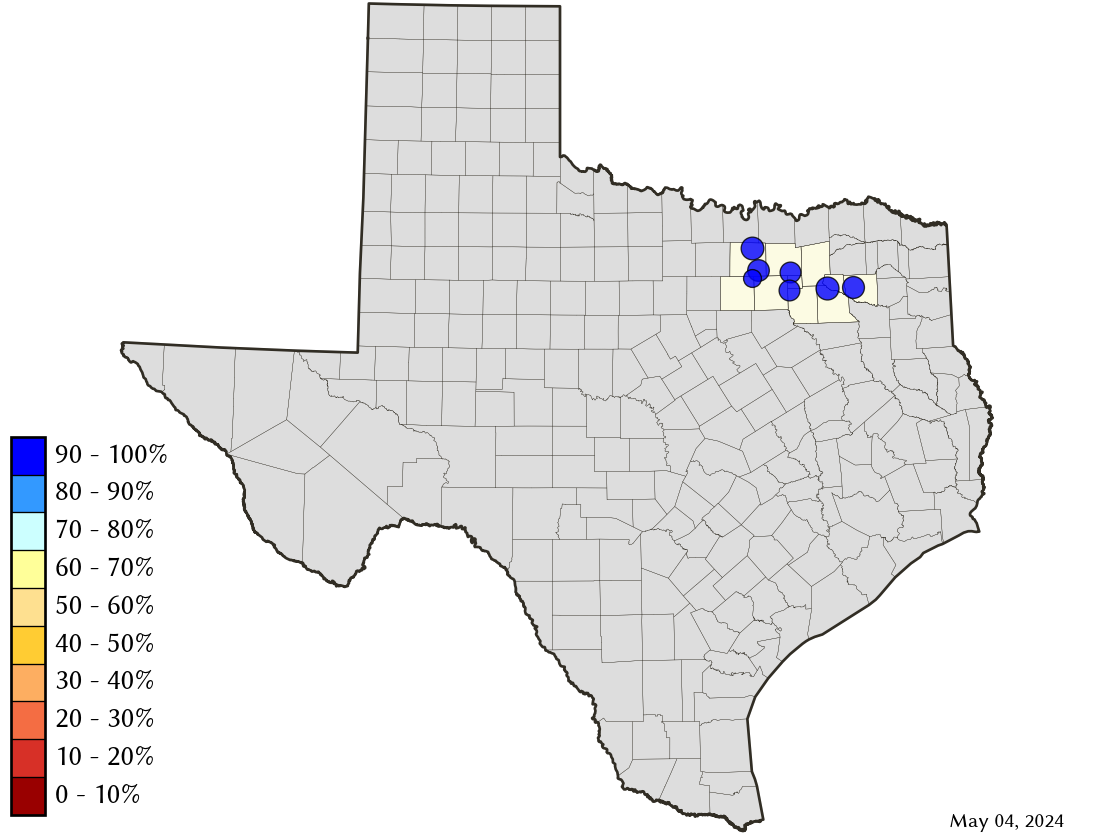
Area Map
Reservoir Storage
| Reservoir | Type | Percent Full |
Water Level (ft) |
Height Above Conservation Pool (ft) |
Reservoir Storage (acre-ft) |
Conservation Storage (acre-ft) |
Conservation Capacity (acre-ft) |
Surface Area (acres) |
|---|---|---|---|---|---|---|---|---|
| Fork |

|
100.0 | 403.46 | 0.46 | 648,805 | 605,061 | 605,061 | - n.a. - |
| Grapevine |

|
100.0 | 535.86 | 0.86 | 168,827 | 163,064 | 163,064 | - n.a. - |
| Lavon |
|
100.0 | 492.34 | 0.34 | 419,649 | 409,757 | 409,757 | 20,859 |
| Lewisville |
|
100.0 | 522.28 | 0.28 | 606,491 | 563,228 | 563,228 | - n.a. - |
| Ray Hubbard |
|
100.0 | 435.50 | 0.00 | 439,559 | 439,559 | 439,559 | 20,947 |
| Ray Roberts |
|
100.0 | 632.58 | 0.08 | 790,761 | 788,167 | 788,167 | - n.a. - |
| Tawakoni |
|
100.0 | 437.69 | 0.19 | 878,735 | 871,685 | 871,685 | - n.a. - |